Analyzing SAT Scores: Visualizations and Insights from the Visualization_data Dataset
This assignment engages students in analyzing SAT scores using visual methods. It includes creating multiple histograms with varying bin widths to observe differences, and generating boxplots for SAT scores by different categories. Participants will derive percentile scores and compare characteristics of students by class rank and gender. Additionally, a US map visualization will depict average state SAT scores, highlighting the best and worst states. Further analyses involve using distributions for various demographics, such as females, seniors, and high GPA students from California.

Analyzing SAT Scores: Visualizations and Insights from the Visualization_data Dataset
E N D
Presentation Transcript
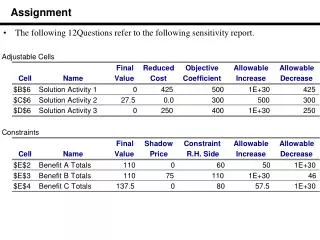
Assignment • Use the dataset “Visualization_data” for this exercise. • Use the variable “SAT”. Create several histograms with different intervals/binwidth and answer this question: Do they look the same? If not, describe the difference. • Create a boxplot using SAT. • Find the scores that correspond to these percentiles: 25%, 50% 75%. • In Graph builder create boxplots of SAT by rank (freshman, sophomore, junior, senior). Report the characteristics. • Repeat the same as above for gender.
Assignment • Open the data set visualization_data.jmp • Use Graph builder to make a US map. Show the SAT scores on the map. Which states have best and worst average SAT scores? Write it down. • Do the same as above for “scores” • Use “distributions” to show all variables, except ID. Click on Females of “gender.” Who are they in terms of their attributes of other variables? Write it down. • Do the same for “Senior” • Do the same for students whose GPA is 3.0 or higher. • Do the same for students who come from California.