Download
1 / 10
100 likes | 420 Vues
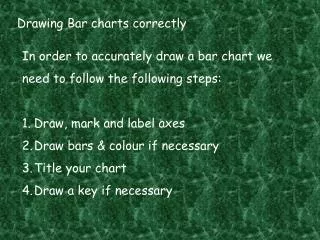
Drawing Bar charts correctly. In order to accurately draw a bar chart we need to follow the following steps: Draw, mark and label axes Draw bars & colour if necessary Title your chart Draw a key if necessary. Drawing Bar charts correctly. Draw, mark and label axes Use a ruler to

E N D
Drawing Bar charts correctly • In order to accurately draw a bar chart we • need to follow the following steps: • Draw, mark and label axes • Draw bars & colour if necessary • Title your chart • Draw a key if necessary
Drawing Bar charts correctly • Draw, mark and label axes • Use a ruler to • draw both axes • Make sure they • are long enough!
Drawing Bar charts correctly • Draw, mark and label axes • Mark both • axes with • equal spacing. • Make sure there • are enough marks
Drawing Bar charts correctly • Draw, mark and label axes • number the • vertical axis • and label it • “Frequency” 5 BECAREFUL The numbers DO NOT go between the spaces 4 3 Frequency 2 1 0
Drawing Bar charts correctly 1. Draw, mark and label axes The horizontal axis shows what you are measuring. 5 BE CAREFUL The categories you have for this axis DO go between the marks on the axis! 4 3 Frequency 2 1 0 Red Blue Green Yellow Other Favourite colours
Drawing Bar charts correctly 2. Draw bars & colour if necessary REMEMBER If a bar has a frequency of 0, don’t draw a bar! 5 4 3 Frequency 2 1 0 Red Blue Green Yellow Other Favourite colours
Drawing Bar charts correctly 3. Title your chart. All titles are “Bar chart to show…” followed by what you’re trying to show. Bar chart to show class 8’s favourite colours 5 4 3 Frequency 2 1 0 Red Blue Green Yellow Other Favourite colours
Drawing Bar charts correctly 4. Draw a key if necessary Sometimes a bar chart has shows 2 sets of data and we need a key to tell them apart. Bar chart to show class 8’s favourite colours 5 4 3 Frequency 2 1 0 Red Blue Green Yellow Other Favourite colours
Drawing Bar charts correctly 4. Draw a key if necessary Bar chart to show class 8’s favourite colours 5 4 Key 3 Boys Girls Frequency 2 1 0 Red Blue Green Yellow Other Favourite colours
Drawing Bar charts correctly • REMEMBER • Draw, mark and label axes • Draw bars & colour if necessary • Title your chart • Draw a key if necessary