Download

1 / 6
60 likes | 240 Vues
Pie Charts and Bar Graphs. August 23, 2011. The Pie Chart. Example Pie Chart. Draw a circle Change the percent to a decimal Multiply the decimal by 360 Measure out each piece (angle) of the chart to draw. Steps for making a Pie Chart. Bar Graph. Example Bar Graph.

E N D
Pie Charts and Bar Graphs August 23, 2011
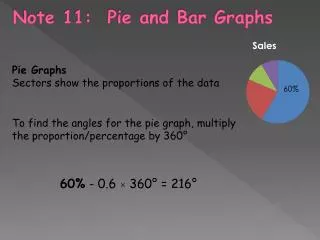
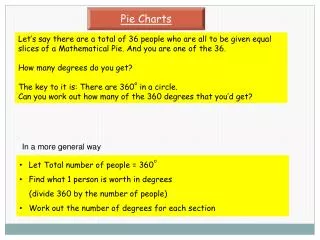
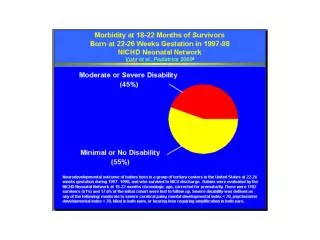
The Pie Chart Example Pie Chart Draw a circle Change the percent to a decimal Multiply the decimal by 360 Measure out each piece (angle) of the chart to draw Steps for making a Pie Chart
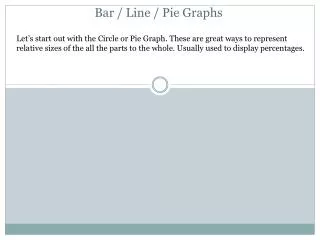
Bar Graph Example Bar Graph Make a title and label the axis The vertical axis scale needs to be denoted and equal Make sure the bars are the same width but not touching Put everything into categories Steps to make a Bar Graph
Vocabulary • Add the next two words to your vocabulary sheet and discuss with the people around you. You have 5 minutes to come up with the definitions. • Categorical Variable • Quantitative Variable
State Lotto Types • Make a Pie Chart and Bar Graph of the State Lottery Sales by Type of Game.
Practice Problem • Answer problem 4.3 on page 207. Answer in complete sentences, and show your work. • You can either do a bar graph or pie chart. Make sure to make it look nice as you will be turning it in for credit.