Pie Charts Construction Guide: Car Survey Data
Learn how to construct a pie chart from car survey data, calculate missing angles, and interpret results. Includes practice questions and answers.


Pie Charts Construction Guide: Car Survey Data
E N D
Presentation Transcript
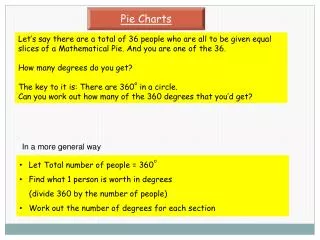
Pie Charts Be able to construct a pie chart from a collection of data, using a protractor.
Makes of car in a school car park Construct a pie chart to show this information. A full circle is 360o There are a total of 3+2+4+1 = 10 cars We use 36o to represent each car 360o
Work out the missing numbers on this number spider 12 90 30 ÷ 30 ÷ 4 ÷ 12 360 4 15 ÷ 90 ÷ 24 ÷ 20 ÷ 15 24 18 ÷ 10 36
Makes of car in a school car park 3x36o=108o 2x36o=72o 4x36o=144o 1x36o=36o We use 36o to represent each car so the3 Cavaliers are represented by 3x36o = 108o Work out the angle needed for each of the other models of car
Makes of car in a school car park Mark the centre of the pie and draw the circle. Draw a line from the centre to the edge Measure the first angle needed (108o) Draw in the line and label the section Cavalier 108o
Makes of car in a school car park From this line measure the next angle, draw the line and label the section. Continue in this way Check that the last section has the correct angle and label it. Volvo 36o Cavalier Rover 144o 72o Ford
Why? • Why do we use 36o to represent 1 car? • What would happen if there were 20 cars? • What about 60 cars? Or 15 cars? If there were 20 cars in your survey, what angle would you use to represent 4 cars? 7 cars? 12 cars?
Construct Pie charts questions Q1 A survey of how 30 pupils got to school Q2 How Cameroon spent his £40 birthday money Q3 Who is your favourite Telly-Tubby survey.
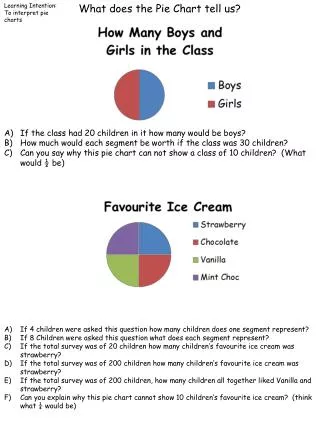
Interpreting Pie Charts 20 pupils in class 3B travel to school. From the chart find the number of pupils who travel by each method. Walk = Cycle = Bus =
180 boys in year 5 chose their favourite sport. From the chart find how many chose each sport.
300 passengers boarded a train in London. From the chart find how many are travelling to each destination.
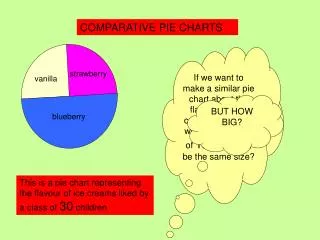
150 packets of crisps were sold from a vending machine. From the chart find the number for each flavour. Find also the percentage for each.
Answers Sports:Football: 72, Rugby 40, Hockey 30Cross Country 20, Squash 18 pupils. Passengers: Southampton 100, Bournemouth 75, Poole 50, Branksome 45, Parkstone 30. Crisps: Plain 60, Cheese & Onion 45,Salt & Vinegar 30, Prawn Cocktail 15