COMPARATIVE PIE CHARTS
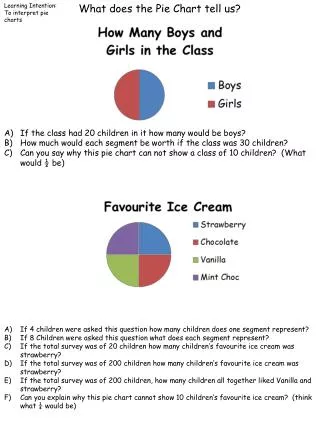
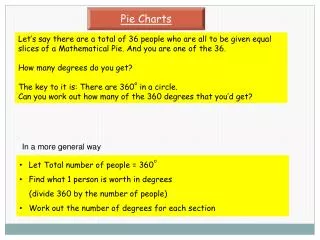
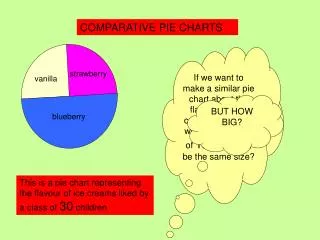
COMPARATIVE PIE CHARTS. If we want to make a similar pie chart about the flavours of ice creams liked by a whole year group of 120 should it be the same size?. strawberry. vanilla. BUT HOW BIG?. blueberry.

COMPARATIVE PIE CHARTS
E N D
Presentation Transcript
COMPARATIVE PIE CHARTS If we want to make a similar pie chart about the flavours of ice creams liked by a whole year group of120should it be the same size? strawberry vanilla BUT HOW BIG? blueberry This is a pie chart representing the flavour of ice creams liked by a class of 30 children
What would happen to the area if we multiplied the side length by 3? We are going to make this 3 x 3 square bigger by making the sides twice as long NOT JUST ONE SIDE – WE MUST END UP WITH A SQUARE!!! So how many times bgger in AREA is the large square when compared to the small one?
Lengths x 4 20cm 5cm Area = 25 cm2 Does it matter what size square we start with? Area = 400 cm2 Areas x 16 Areas x 100 Length x 10 50cm Area = 2500 cm2
So we can summarise: Fill out the table below 256 64 125 5 25h 10w 36 7 k
So now to the pie charts Area scale factor = 9 Area = 180cm2 Area = 20 cm2 So how many times longer is the radius? Length scale factor = 3
So now to the pie charts Area scale factor = 16 Pie chart to represent 320 people Pie chart to represent 20 people So if we make the radius of the small circle 6cm how long is the radius of the large circle? Length scale factor = 4 So the radius of the large circle would be 4 x 6 = 24 cm
So now to the pie charts Area scale factor = 10 Pie chart to represent 400 people Pie chart to represent 40 people So if we make the radius of the small circle 3cm how long is the radius of the large circle? Length scale factor = √10 So the radius of the large circle would be √10 x 3 = 3 √10 cm
COMPARATIVE PIE CHARTS If we want to make a similar pie chart about the flavours of ice creams liked by a whole year group of120should it be the same size? strawberry vanilla The radius of the pie chart for 30 children is 5cm, what is the radius for the pie chart for 120 children? blueberry This is a pie chart representing the flavour of ice creams liked by a class of 30 children 10 cm
Work sheet for comparative pie charts Squares Generally Pie Charts