

SlideServe
Menu
Préférences
© SlideServe · v2026

Pie Charts

sawyer avatar
4 diapositives · 501 Views · Oct 08, 2014

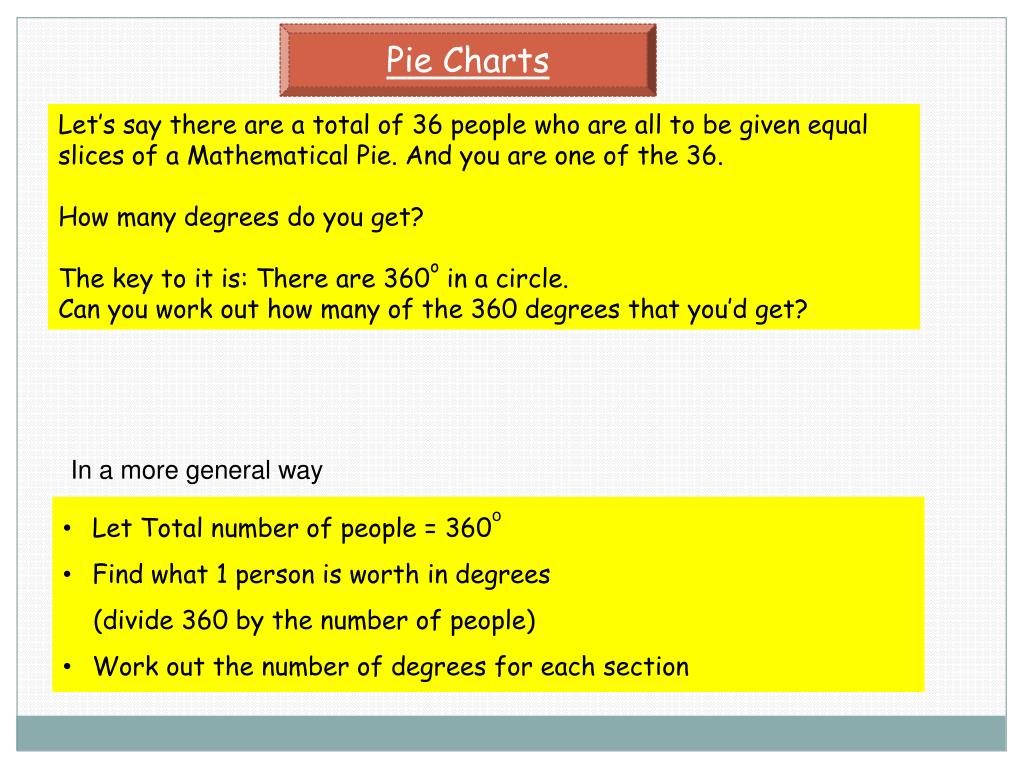
Pie Charts. Let’s say there are a total of 36 people who are all to be given equal slices of a Mathematical Pie. And you are one of the 36. How many degrees do you get? The key to it is: There are 360 o in a circle. Can you work out how many of the 360 degrees that you’d get?.
Pie Charts - slide 1
01 / 4Pie Charts
1 / 17

Télécharger la présentation

Pie Charts
Une image / un lien ci-dessous est fourni (tel quel) pour télécharger la présentation

Politique de téléchargement : le contenu du site vous est fourni TEL QUEL pour votre information et votre usage personnel ; il ne peut être vendu, concédé sous licence ni partagé sur d’autres sites sans l’accord de son auteur.Le contenu vous est fourni TEL QUEL, pour votre information et votre usage personnel uniquement. Téléchargez la présentation en cliquant sur ce lien. Lors du téléchargement, si vous ne parvenez pas à télécharger une présentation, l’éditeur a peut-être supprimé le fichier de son serveur.Pendant le téléchargement, si vous ne parvenez pas à obtenir une présentation, le fichier a peut-être été supprimé par l’éditeur.

F I N

Plus de contenu associé

Transcription de la présentation
  1. Pie Charts Let’s say there are a total of 36 people who are all to be given equal slices of a Mathematical Pie. And you are one of the 36. How many degrees do you get? The key to it is: There are 360o in a circle. Can you work out how many of the 360 degrees that you’d get? In a more general way • Let Total number of people = 360o • Find what 1 person is worth in degrees (divide 360 by the number of people) • Work out the number of degrees for each section

  2. eg1. Complete a pie chart for the following data A class were surveyed about there favourite ice cream 24 people = 3600 360 24 1 person = 1 person = 150 6 people = 900 4 people = 600 600 900 x 7 people = 1050 1050 600 3 people = 450 450 4 people = 600

  3. eg2. Complete a pie chart for the following data A year group were surveyed about there favourite group 120 people = 3600 360 120 1 person = 1 person = 30 25 people = 750 40 people = 1200 1200 750 x 15 people = 450 150 1050 450 35 people = 1050 150 5 people =

  4. IN SUMMARY - Drawing a pie chart • Mark the centre of the circle C with an x • Place the point of the compass here and draw your circle • (any radius but 4cm would be good for practice) • Draw a horizontal line from the centre of the circle • X to the left side of the circle x • Place the heart of the protractor at x and the 00 along the line …. and • measure the required angle • Place the heart of the protractor at x and the 00 along the line you have just drawn and measure the required angle