Download

1 / 5
50 likes | 545 Vues
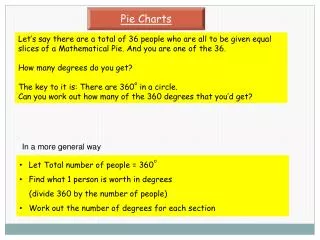
Bar graphs and pie charts. Bar graphs. The list below shows where people like to eat: 25% McDonald’s (McD) 10% KFC (KFC) 5% Burger King (BK) 60% PFC (PFC). “Check”. McD. KFC. BK. PFC. Pie charts. The list below shows where people like to eat: 25% McDonald’s 10% KFC 5% Burger King

E N D
Bar graphs The list below shows where people like to eat: 25% McDonald’s (McD) 10% KFC (KFC) 5% Burger King (BK) 60% PFC(PFC) “Check” McD KFC BK PFC
Pie charts The list below shows where people like to eat: 25% McDonald’s 10% KFC 5% Burger King 60% PFC 90 + 36 + 18 + 216 = 360
In your groups: • (a) Use the data to construct bar graphs. Use a colour code to shade in the bars. Keep it consistent. • (b) Construct pie charts from the same data. Use the same colour codes. • Check your pie chart is correct, using reverse calculation. • Compare your graphs and write what you notice about the modes of each piece of data. • (e) Compare the work with another group and confirm your overall findings.