Download

1 / 10
110 likes | 309 Vues
Creating and Understanding Pie Charts. What is a Pie Chart?. A pie chart is a circular chart (pie-shaped); it is split into segments to show percentages or the relative contributions of categories of data. How do I draw a pie chart? Step 1.

E N D
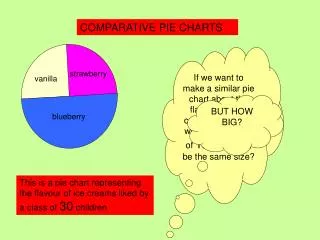
What is a Pie Chart? A pie chart is a circular chart (pie-shaped); it is split into segments to show percentages or the relative contributions of categories of data.
How do I draw a pie chart?Step 1 • Decide on the total number of categories. In other words, identify the categories that you will use. • Collect the data so the number per category can be counted (Frequency Table)
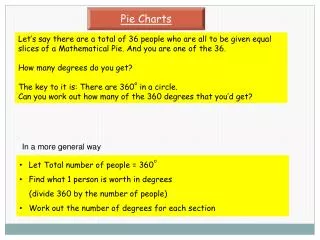
How do I draw a pie chart?Step 2 To calculate degree share, you need to divide the share that the category has by the total units and then multiply by 360 (there are 360 degrees (°) in a circle).
How do I draw a pie chart?Step 3 – Drawing the chart Lightly, draw a vertical line through the centre 1st Draw a Circle With a protractor measure 72o Mark this angle and draw a line from the centre to the mark You should now be left with 36o And finally 54o Turn the protractor so that the zero is now on this line Again, turn the protractor Now measure 108o Now measure 90o Please note that due to the limitations of the software some measurements on this screen are not totally accurate. Again, turn the protractor so that zero is now on this line
How do I draw a pie chart?Step4 It may be necessary to work out the percentage and include this in the labelling. How would we do this? To calculate degree share, you need to divide the share that the category has by the total units and then multiply by 100 (the whole circle is equal to 100%).
Exercises Use a pie chart to illustrate the data given below, fully label the chart and show the percentage value of each sector. 180 FE college students were asked what they intended to do next year.
Exercises At a concert, the ages of 115 people were recorded as: Draw a pie chart using this data, give the data labels values in % ages
Thirty people were surveyed in a shopping centre and asked their ages. These are displayed below. 54 41 65 46 66 37 32 71 34 73 15 26 64 22 54 8 58 43 14 57 43 52 24 68 43 39 59 35 48 49 a) Draw a tally-frequency table. b) Using the data in your frequency table, construct a table to calculate the angles in a pie chart. c) draw and fully labelled a pie chart to show the percentage values.