Download
1 / 15
150 likes | 283 Vues
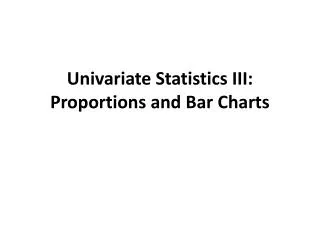
Univariate Statistics III: Proportions and Bar Charts. What you should learn. Calculating proportions Calculating odds Levels of measurement (and that it is confusing!) Bar charts. People are still being prosecuted as witches.

E N D
What you should learn • Calculating proportions • Calculating odds • Levels of measurement (and that it is confusing!) • Bar charts
People are still being prosecuted as witches. • In the US this persecution is trivialized with shot glasses. • Would museums in Dachau, Darfur, and Hiroshima take the same attitude to those killed?
Back to statistics: Proportions single: 51/241 = .21 widowed: 38/241 = .16 divorced: 4/241 = .02 married: 148/241 = .61 sum 241/241 = 1.00 Is a graph better than a table?
Calculating Odds single: 51/190 = .27 A proportion of .50 widowed: 38/203 = .19 equates with an odds divorced: 4/237 = .02 of 1.00. married: 148/93 = 1.59
Proportion v Odds • Proportions make more sense to most people. • Proportions are estimates of the underlying probability. • Odds are used in more advanced statistical models. The odds ratio is discussed later this book. It is the ratio of two odds.
Stevens’ Measurement Levels • Qualitative (non-metric) • Binary (dummy variables) (sometimes not included) • Nominal (categorical) • Ordinal (or ordered) • Quantitative (metric) • Interval • Ratio (sometimes this included, sometimes not) • Constraints on the types of operations that you can do with each level. • Controversial since it was proposed, but textbook writers like it (since it can help structure books???).
Traditional Levels of Measurement (Stevens) • Categorical/Nominal ___________________ • just names • Ordinal ___________________ • just order • Interval ___________________ • difference between 1 and 2 is the same as 4 and 5 • Ratio ___________________ • difference between 1 and 2 is the same as 4 and 8
Biased Sampling (Fienberg, 1971) • Being drafted for the Vietnam War • Not intended to be an SRS • “One of equal and uniform treatment for all men in like circumstances” (President Johnson, 6-3-1967) • Drafted by birthday • 366 capsules • Filled 31 with Jan. dates, put in box and pushed to one end. Repeated with Feb., pushing them to same end. etc. • Shook “several times,” carried up and down stairs, poured into a bowl. • More likely to be drafted if born in later months.
Mean Lottery Number with Birth Month Level of measurement?
Pragmatic views of Levels of Measurement Velleman and Wilkinson (1993) note that Stevens’ typology more relevant for maths than science. It does “not control which statistics may ‘sensibly’ be used, but only which ones may ‘puristically’ be used” (Tukey, 1986, p. 244)
Summary • Categorical data (sometimes called nominal or qualitative data) are common in social science. • Proportions and odds are useful measures. • Levels of measurement traditionally are: • interval, ordinal, and categorical • But is it more involved and disputed than discussed in most statistics textbooks.