Download
1 / 28
280 likes | 379 Vues
Learn how to test for exclusion and stationarity in long-run relations by imposing restrictions on parameters with statistical tests like LR-test and Chi-Square. Understand the number of restrictions and free parameters for accurate analysis.

E N D
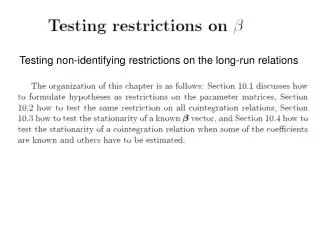
Testing non-identifying restrictions on the long-run relations
Specify either the number of free parameters or the number of restrictions
How many ’same restrictions’ can we impose on β? • When the test rejects!
TEST FOR EXCLUSION: LR-test, Chi-Square(r) r DGF ChiSq5 LM3R DPY RM LYR RB DS831 1 1 3.84 7.10 17.87 0.28 1.05 2.09 0.10 (0.01) (0.00) (0.60) (0.31) (0.15) (0.75) 2 2 5.99 12.36 23.17 0.92 5.63 3.10 3.52 (0.00) (0.00) (0.63) (0.06) (0.21) (0.17) 3 3 7.81 24.71 38.24 14.99 17.63 14.77 18.47 (0.00) (0.00) (0.00) (0.00) (0.00) (0.00) 4 4 9.49 32.53 46.95 22.84 22.55 22.90 24.90 (0.00) (0.00) (0.00) (0.00) (0.00) (0.00)
LM3R LYR DPY RM RB DS831 TREND Beta1 0.07 -0.03 1.00-0.29 0.57 -0.00 0.00 Beta2 1.00 -1.02 -3.45 -8.51 8.00 -0.24 -0.00 Beta3 -0.00 0.02 0.02 1.00 -0.62 -0.01 -0.00 Alpha1 Alpha2 Alpha3 DLM3R -1.05 -0.15 1.18 (-2.56) (-3.95) (1.11) DLYR -0.06 0.05 -1.54 (-0.26) (2.10) (-2.42) DDPY -0.71 0.04 -0.30 (-5.05) (2.77) (-0.84) DRM 0.02 -0.00 -0.10 (0.92) (-1.84) (-2.14) DRB 0.02 0.00 0.16 (0.81) (0.90) (2.47)
PI matrix: LM3R LYR DPY RM RB DS831 TREND DLM3R -0.23 0.22 -0.50 2.80 -2.56 0.03 0.00 (-4.78) (4.47) (-1.15) (2.51) (-3.35) (2.91) (0.60) DLYR 0.05 -0.09 -0.26 -1.93 1.31 -0.00 0.00 (1.78) (-2.89) (-1.00) (-2.90) (2.86) (-0.46) (0.46) DDPY -0.01 -0.02 -0.84 -0.41 0.08 -0.01 -0.00 (-0.50) (-1.23) (-5.69) (-1.07) (0.31) (-1.56) (-2.77) DRM -0.00 0.00 0.03 -0.08 0.05 0.00 0.00 (-0.81) (0.08) (1.35) (-1.58) (1.36) (2.63) (2.96) DRB 0.00 0.00 0.02 0.13 -0.07 -0.00 -0.00 (0.99) (0.36) (0.60) (1.98) (-1.51) (-2.12) (-2.05)
Testing hypotheses on a single beta relation • Counting degrees of freedom of the restricted vector • r-1 restrictions and 1 normalization without testing • additional restrictions change the likelihood function
Tests of stationarity around a constant mean TEST FOR STATIONARITY: LR-test, Chi-Square(6-r) r DGF ChiSq5 LM3R DPY RM LYR RB 1 5 11.07 48.23 36.31 46.18 47.85 49.25 (0.00) (0.00) (0.00) (0.00) (0.00) 2 4 9.49 28.46 25.50 26.39 28.21 29.49 (0.00) (0.00) (0.00) (0.00) (0.00) 3 3 7.81 23.21 21.10 21.13 23.01 24.18 (0.00) (0.00) (0.00) (0.00) (0.00) 4 2 5.99 9.97 9.09 10.01 9.79 10.12 (0.01) (0.01) (0.01) (0.01) (0.01)
Tests of stationarity allowing for a shift in the mean at 1983 TEST FOR STATIONARITY: LR-test, Chi-Square(5-r) r DGF ChiSq5 LM3R DPY RM LYR RB 1 4 9.49 37.97 17.72 43.92 44.29 39.81 (0.00) (0.00) (0.00) (0.00) (0.00) 2 3 7.81 19.24 9.13 25.28 24.90 20.62 (0.00) (0.03) (0.00) (0.00) (0.00) 3 2 5.99 17.03 8.98 20.58 20.32 16.75 (0.00) (0.01) (0.00) (0.00) (0.00) 4 1 3.84 8.69 5.81 7.30 9.38 5.93 (0.00) (0.02) (0.01) (0.00) (0.01)
Testing hypotheses on a single beta relation Example H26: Homogeneity between interest rates and inflation