Download

1 / 20
210 likes | 502 Vues
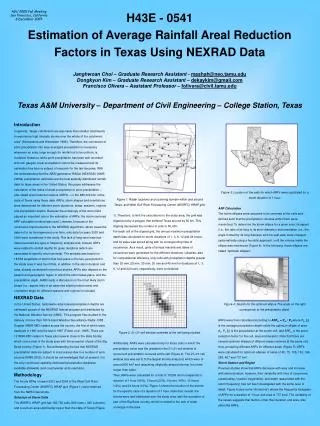
Automatic Calibration of HSPF model with NEXRAD rainfall data for DMIP. Jae Ryu Hydrologist, National Drought Mitigation Center University of Nebraska Lincoln, NE 68583. The Distributed Model Intercomparison Project (DMIP-2) Workshop Hydrology Laboratory, Office of Hydrologic Development,

E N D
Automatic Calibration of HSPF model with NEXRAD rainfall data for DMIP Jae Ryu Hydrologist, National Drought Mitigation Center University of Nebraska Lincoln, NE 68583 The Distributed Model Intercomparison Project (DMIP-2) Workshop Hydrology Laboratory, Office of Hydrologic Development, National Weather Service, Silver Spring, Maryland – USA September 10-12, 2007
Outline • Hydrological Simulation Program-Fortran (HSPF) • Methodology (Data and Analysis) • Key hydrologic parameters for HSPF • Calibration Efforts • Results and future work
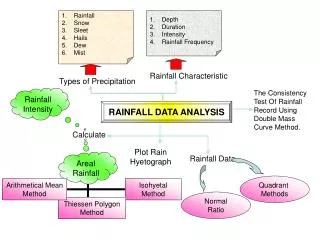
HSPF • Hydrological Simulation Program-Fortran (HSPF)-Stanford Watershed Model (Crawford and Linsley 1966) • Lumped model-homogeneous land segments in each delineated sub-basins • Better Assessment Science Integrating Point and Nonpoint Sources (BASINS) – EPA 1996 • GIS capability- Semi-distributed model (hspf)
UZS LZS HSPF(Hydrologic Cycle) A copy available at my desk!!
Methodology • Forcing data (8km x 8km) – Hourly Nexrad (4km x 4km) and NARR-a (Poevap-32km x 32km) • Pseudo-Station network – Elk River (30), Illinois River (44), and Blue River (19)
30 44 19
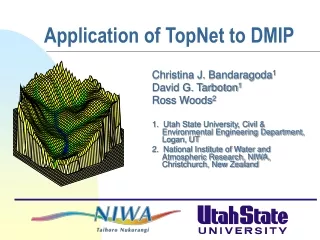
Methodology (Cont’d) • BASINS Data (GIS) DEM, STATSGO, Stream network (NHD), Land Cover, etc. • Watershed Delineation Tools Delineate sub-basins
Key Hydrologic Parameters • AGWETP: Fraction of remaining potential evapotranspiration from active groundwater • AGWRC: Base groundwater recession rate • BASETP: The fraction of potential evapotranspiration from baseflow • CEPSC: Interception storage capacity • DEEPFR: Fraction of groundwater inflow to deep recharge • INFILT: Infiltration rate • IRC: Interflow recession parameter • KVARY: Variable groundwater recession flow • LZETP: Lower zone evapotranspiration parameter • LSUR: Length of the assumed overland flow • LZSN: Lower zone nominal soil moisture storage • NSUR: Manning’s roughness for overland flow • UZSN: Upper zone nominal soil moisture storage
Calibration Procedure (Cont’d) • Annual Water Balance – Adjust Evaporation by multiplying factors to minimize the differences between observed and simulated flow • Seasonal Water Balance (interflow and groundwater)– Adjust physical hydrologic parameters as well as monthly parameters (e.g. monthly intercept storage capacity parameter (inches), monthly lower zone evaporation parameters at start in each month • Peak and low flows – Adjust physical hydrologic parameters (e.g. infiltration and percolation rate)
Auto Calibration • Parameter Estimation (PEST) Software – a module built in HSPF • Model Independent Parameter Estimator– Minimize the bias between observed and simulated flows by many runs • Enhancements and improvement of PEST – Difficulty of hourly calibration, non-physical based parameter estimator, but still promising in terms of saving time and efforts
Results Hydrograph for the Illinois River at Baron for wettest water year (October 1 1998-Spetember 30, 1999)
Results Hydrograph for the Illinois River at Siloam for wettest water year (October 1 1998-Spetember 30, 1999)
Results Hydrograph for the Illinois River at Tahlequah for wettest water year (October 1 1998-Spetember 30, 1999)
Results Exeedance Probability of observed and simulated flow with/without calibration over the calibration period at Tahlequah
Absolute Peak Error 76.15% Vs 182.84% Results (Cont’d)
Conclusion • HSPF is well suited to DMIP2 • Obviously, calibrated flow outperfomed uncalibrated flows • PEST works well, but enhancemenent and improvement needed • Ready to simulate Western Basin