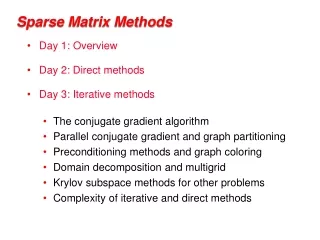
Probabilistic Sparse Matrix Factorization
Probabilistic Sparse Matrix Factorization. Delbert Dueck, Quaid Morris, Brendan Frey (Probabilistic & Statistical Inference Group) Tim Hughes (Banting and Best Department of Medical Research). Objective.

Probabilistic Sparse Matrix Factorization
E N D
Presentation Transcript
Probabilistic Sparse Matrix Factorization Delbert Dueck, Quaid Morris, Brendan Frey(Probabilistic & Statistical Inference Group) Tim Hughes(Banting and Best Department of Medical Research)
Objective Patterns in gene expression array data can be used to help understand gene regulation and predict the function of yet-uncharacterized genes Objective: To develop a method of probabilistic sparse matrix factorization (PSMF) and apply it to gene expression data to learn the hidden structure underlying the data.
Biological Background • Genes encode basic information about an organism • They tend to be highly expressed in tissues related to their functional role • Mouse gene expression data is from Zhang, Morris, et al. (2004) • Gene expression is influenced by the presence of transcription factors (TFs) • Co-expressed genes are likely activated by the same TFs • The activity of each gene can be explained by the activities of a small number of transcription factors
Expression vector for gene XM_133866.1xg (g=10056), a row vector of length T=55 bladder (t=3) colon (t=9) hindbrain (t=22) large intestine (t=25) lymph node (t=28) midbrain (t=31) pancreas (t=34) small intestine (t=41) spleen (t=44) stomach (t=45) Scalar expression values (xgt ) Gene Expression Array Dataset G=22709 genes Entire data set: XG×T matrix (G=22709, T=55) 100 genes T=55 tissues T=55tissues
Sparse Matrix Factorization • Gene expression data model: • Each gene’s expression profile (xg) is … a linear combination (weighted by ygc, csg) … of a small number (rg<N) … of C possible transcription factor profiles (zc, csg)
Sparse Matrix Factorization Matrix format: (entire dataset)
Probabilistic Sparse Matrix Factorization • To express as a distribution, assume … • varying levels of Gaussian noise in the data: • nothing about transcription factor weights: • normally-distributed transcription factor profiles: • uniformly-distributed factor assignments: • multinomially-distributed factor counts:
Probabilistic Sparse Matrix Factorization • To express as a distribution, assume … • varying levels of Gaussian noise in the data: • nothing about transcription factor weights: • normally-distributed transcription factor profiles: • uniformly-distributed factor assignments: • multinomially-distributed factor counts: • Multiply together to get joint distribution
Factorized Variational Inference • Exact inference is intractable with P(∙)
Factorized Variational Inference • Exact inference is intractable with P(∙) • Approximate it by a simpler distribution, Q(∙), and perform inference on that
Visualization PROBABILISTIC SPARSE MATRIX FACTORIZATION C=50 possible factors N=3 factors per gene (max) P(rg)=[.55 .27 .18] *Sorted by primary transcription factor (sg1)
Results – p-value histograms • Genes can be partitioned into “primary categories” (i.e. same sg1 value), “secondary classes”, etc. • Compare classes with annotated gene ontology (GO-BP) categories for statistical significance
Future Directions – different Q(·) Iterated conditional modes (point estimates)
Summary • Introduced probabilistic sparse matrix factorization (PSMF), each row is a linear combination of a “small” number of hidden factors selected from a larger set. • Described a variational inference algorithm for fitting the PSMF model. • Evaluated model on a gene functional prediction task.