Download
1 / 64
640 likes | 791 Vues
Beam Energy Programs in HIC Part I: Past. Christoph Blume University of Frankfurt. Outline: Experiments. Beam energy scan programs with heavy ions Part I: Past AGS: e.g. E895 SPS: NA49 (NA45, NA57) Part II: Present RHIC: STAR, PHENIX SPS: NA61 Part III: Future NICA: MPD

E N D
Beam Energy Programs in HICPart I: Past Christoph Blume University of Frankfurt
Outline: Experiments Beam energy scan programs with heavy ions Part I: Past AGS: e.g. E895 SPS: NA49 (NA45, NA57) Part II: Present RHIC: STAR, PHENIX SPS: NA61 Part III: Future NICA: MPD FAIR: CBM Christoph Blume, Dubna Aug. 2012
Outline: Physics Scan of the QCD phase diagram Search for the onset of deconfinement Locate the phase boundary to QGP Order of the phase transition (cross over ↔ 1st order) Search for the QCD critical point Systematic scan of relevant area in phase diagram Search for new QCD phases and exotica E.g. Quarkyonic matter Christoph Blume, Dubna Aug. 2012
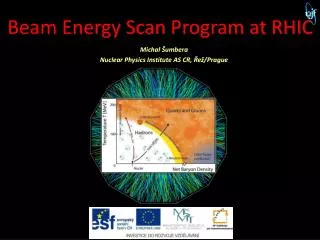
The QCD Phase Diagram Topic of this lecture Part of phase diagram with μB > 0 μB = 0: LHC physics Questions to experiments 1) Is it possible to locate the onset of deconfinement ? 2) Is there any evidence for a 1st order phase transition ? 3) Can one find any indication for a possible critical point ? RHIC SPS FAIR NICA Christoph Blume, Dubna Aug. 2012
Analogy: Phase Diagram of Water Cross over Critical point 1st order phase boundary Christoph Blume, Dubna Aug. 2012
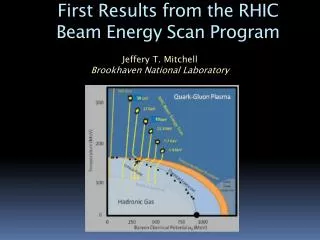
Beam Energy Scan Control parameter: √sNN Allows to scan different regions of phase diagram System freezes out at different positions along freeze-out curve Trajectory might cross critical area Variation of system size Program of NA61@SPS H. Stöcker, E.L. Bratkovskaya, M. Bleicher, S. Soff, and X. Zhu, JPG31, S929 (2005) Y.B. Ivanov, V.N. Russkikh, V.D. Tonnev, PRC73, 044904 (2006) 3-fluid hydro Christoph Blume, Dubna Aug. 2012
RHIC sNN = 5-200 GeV SPS sNN = 6–17 GeV AGS sNN = 2.7–5 GeV Beam Energy Scan Region of high baryon density RHIC SPS FAIR / NICA (/ AGS) Christoph Blume, Dubna Aug. 2012
Alternating Gradient Synchrotron Christoph Blume, Dubna Aug. 2012
HIC Experiments at the AGS Christoph Blume, Dubna Aug. 2012
The E895 Experiment Time Projection Chamber EOS-TPC Beam energy scan Au+Au 2.4 < √sNN < 4.8 GeV 2 < Elab < 10.8 A GeV Observables π±, p, K0s, Λ, Ξ- Spectra, HBT, directed and elliptic flow Christoph Blume, Dubna Aug. 2012
CERN Accelerator Complex Christoph Blume, Dubna Aug. 2012
CERN Accelerator Complex LHC North Area SPS West Area PS Christoph Blume, Dubna Aug. 2012
HIC Experiments at the SPS Christoph Blume, Dubna Aug. 2012
Beam Energy Scan at the SPS Pb+Pb: 6.3 < √sNN < 17.3 GeV Christoph Blume, Dubna Aug. 2012
The NA49 Experiment Christoph Blume, Dubna Aug. 2012
The NA49 Experiment Christoph Blume, Dubna Aug. 2012
The NA45 Experiment Christoph Blume, Dubna Aug. 2012
The NA57 Experiment Christoph Blume, Dubna Aug. 2012
yP yT yP yT y y y y y’p y’T y0 y0 Baryon-Number Distributions Lower energies: Higher energies: Christoph Blume, Dubna Aug. 2012
How to Measure Them Net-proton distributions: Protons - Antiprotons = - Other contributions (neutrons, hyperons) usually ignored (difficult to measure) Christoph Blume, Dubna Aug. 2012
Energy Dependence of Net-Protons NA49 preliminary BRAHMS: PRL93, 102301 (2004) Christoph Blume, Dubna Aug. 2012
Energy Dependence of y RHIC (sNN= 200 GeV): E = 25.7 ± 2.1 TeV E/Nucleon = 72.0 ± 6.0 GeV Energy loss: Rapidity shift: Christoph Blume, Dubna Aug. 2012
Inelastic Energy per NN Collision Central data Total inelastic energy per NN collision: Energy of single net-baryon: Christoph Blume, Dubna Aug. 2012
Inelasticity of Heavy Ion Collisions Central data p+p ⇒ ≈ 70% of available energy is transformed into particle production and expansion of fireball (p+p ≈ 50%) Inelasticity: Christoph Blume, Dubna Aug. 2012
Net-protons: 3 valence Quarks (uud ) Net s: 2 valence (ud ) + 1 produced Quark (s ) Net s: 1 valence (d ) + 2 produced Quarks (ss ) Omegas: 3 produced Quarks (sss ) Rapidity Distributions of Baryons Central Pb+Pb, 158A GeV dn/dy (a.u.) y Christoph Blume, Dubna Aug. 2012
Antibaryon/Baryon Ratios √sNN dependence gets reduced with increasing strangeness content But even Ω-/Ω+ ratio not energy independent S = -3 S = -2 S = -1 S = 0 PRC78, 034918 (2008) Christoph Blume, Dubna Aug. 2012
Particle Production BRAHMS AGS NA49 Particle yields Lots of data on lighter particles (π, K, Λ) for central collisions (system size less well covered) Data on heavier particles (φ, Ξ, Ω) still relatively scarce Different energy dependences Steeper rise at low energies for K+ and Λ Interplay between net-baryon density and strangeness production Christoph Blume, Dubna Aug. 2012
Strangeness Conservation s s = Isospin Symmetry Isospin Symmetry K+ (us) K- (us) K0 (ds) (uds) K0 (ds) Major Strangeness Carriers: K and Λ >> >> (uds) If baryon density is high Christoph Blume, Dubna Aug. 2012
Relative Strangeness Production Maximum around √sNN = 7-8 GeV Christoph Blume, Dubna Aug. 2012
− − / +/ Particle Production: Hyperons |y| < 0.4 -/ = 1.5 (+ + -) |y| < 0.5 Christoph Blume, Dubna Aug. 2012
Particle Production: K/π Ratios Pronouned maximum for K+/π+ ratio (aka “The Horn”) Not described by transport models Sharper than early statistical model predictions Proposed as signature for the onset of deconfinement M. Gaździcki and M.I. Gorenstein, APPB30, 2705 (1999) Christoph Blume, Dubna Aug. 2012
Chemical Freeze-Out Curve Provides relation between T and μB Christoph Blume, Dubna Aug. 2012
Energy Dependence of T and B A. Andronic et al, NPA772 (2006), 167 Christoph Blume, Dubna Aug. 2012
Particle Production: Stat. Model Latest version of stat. model T(√sNN) and μB(√sNN) parameterized T and μB connected via freeze-out curve Better fit after introduction of additional high mass resonances (Hagedorn-res.) ⇒ Increase of pion yield Decrease of μB ⇒ maximum also in Λ/π A. Andronic et al., PLB673, 142 (2009) Christoph Blume, Dubna Aug. 2012
Strangeness in Heavy Ion Physics Strangeness enhancement as a QGP signature J. Rafelski and B. Müller, PRL48, 1066 (1982) P. Koch, B. Müller, and J. Rafelski, Phys. Rep. 142, 167 (1986) Strangeness has to be produced (no s-Quarks in nucleons) Thresholds are high in hadronic reactions E.g..: N + N N + K+ + (Ethres 700 MeV) Fast equilibration in a QGP via partonic processes E.g. gluon-fusion ⇒ Enhancement of strange particle production in A+A relative to p+p expected (in particular multi-strange particles) Christoph Blume, Dubna Aug. 2012
Strangeness Enhancement √sNN (GeV) Contrary to naive expectation Same behavior for multi-strange particles? More data needed Christoph Blume, Dubna Aug. 2012
QGP Signature ? Is it a dominantly partonic effect or can hadronic processes lead to the same fast equilibration? Multi-meson fusion processes C. Greiner and S. Leupold, J. Phys. G 27, L95 (2001) Dynamic equilibration at the phase boundary? T-μB freeze-out curve follows phase boundaries (QGP or quarkyonic matter) P. Braun-Munzinger, J. Stachel, and C. Wetterich, Phys. Lett. B 596, 61 (2004) Hadronization generally a statistical phenomenon? U. Heinz, Nucl. Phys. A 638, 357c (1998), R. Stock, Phys. Lett. B 456, 277 (1999) Christoph Blume, Dubna Aug. 2012
Radial Expansion and mt-Spectra 1/mT dN/dmT 1/mT dN/dmT mT mT No radial flow: exponential spectrum (p+p collisions) With radial flow: add. boost by expansion (vT) ⇒ blue shifted spectrum Christoph Blume, Dubna Aug. 2012
mt-Spectra: Charged Kaons Sudden change in the Kaon slope parameters (aka “The Step”) Evolution of radial flow changes around √sNN = 7-8 GeV Difficult to model in hadronic transport models Indication for a change of Equation of State (EOS) ? Christoph Blume, Dubna Aug. 2012
Energy Dependence of 〈mT〉 NA49: PRC77, 024903 (2008) Christoph Blume, Dubna Aug. 2012
The QCD Phase Diagram K. Rajagopal, CPOD Conference 09 Christoph Blume, Dubna Aug. 2012
Critical Point Predictions Lattice QCD calculation at finite μB Z. Fodor and S. Katz JHEP 0404, 050 (2004) But current predictions scatter quite a lot The CP might even not exist at all ... P. de Forcrand and O. Philipsen, JHEP01, 077 (2007) M. Stephanov, CPOD conference 09 Christoph Blume, Dubna Aug. 2012
Critical Point Predictions Focusing effect Proximity of critical point might influence isentropic trajectories M. Askawa et al., PRL101, 122302 (2008) Larger critical area possible Y. Hatta and T. Ikeda, PRD67, 014028 (2003) Christoph Blume, Dubna Aug. 2012
Critical Point Observables Critical opalescence Correlation lengths and susceptibilities diverge Heavy ion reactions System size limited ⇒ critical region Correlation length ξ ≈ radius of system Enhanced fluctuations Multiplicity Average pt Particle ratios Conserved quantities Strangeness S Baryon number B Charge Q Higher moments more sensitive M. Cheng et al., PRD79, 074505 (2009) μB = 0 Christoph Blume, Dubna Aug. 2012
Fluctuations Probe the medium response (susceptibilities) Study of hadronization properties Might be sensitive to QGP phase Hadron gas reacts differently than QGP Different number of degrees of freedom Nature of the phase transition Order of the transition (cross over ⇔ 1st order) Existence of critical point ⇒ sudden increase of fluctuations Christoph Blume, Dubna Aug. 2012
Fluctuations • Charged multiplicity n • Extensive quantity • tight centrality selection (1%) • to reduce volume fluctuations • Scaled variance • Energy dependence of • Data narrower than Poisson ( < 1) • Trend reproduced by UrQMD Pb+Pb, 158A GeV 1 < y < ybeam Christoph Blume, Dubna Aug. 2012
Comparison to CP Expectations Average pt fluctuations Quantified by Φpt Multiplicity fluctuations Quantified by scaled variance No √sNN dependence seen Critical point expectation central Pb+Pb K. Grebieszkow, SQM11 B from stat. model fit: F. Becattini et al., PRC73, 044905 (2006) Position of critical point: Z. Fodor and S. Katz JHEP 0404, 050 (2004) Amplitude of fluct. : M. Stephanov et al. PRD60, 114028 (1999) Width of critical region: Y. Hatta and T. Ikeda, PRD67, 014028 (2003) NA49, PRC79, 044904 (2009) Christoph Blume, Dubna Aug. 2012
Particle Ratio Fluctuations Examples: K/π, p/π, K/p Dynamical fluctuations quantified relative to mixed events reference S/B fluctuation as QGP signal V. Koch, A. Majumder, and J. Randrup, PRL95, 182301 (2005) T < Tc: S and B can be unrelated (Kaons: S = -1, B = 0) T > Tc: S and B are correlated (s-Quark: S = -1, B = 1/3) Experimentally: K/p fluctuations Christoph Blume, Dubna Aug. 2012
Particle Ratio Fluctuations Comparison NA49 ↔ STAR Good agreement for p/π Deviations for K/π + K/p at lowest √sNN Likely due to different acceptances: K/π NA49, PRC83, 061902 (2011) NA49, PRC79, 044910 (2009) STAR, PRL103, 092301 (2009) p/π T. Tarnowsky, SQM11 J. Tian, SQM11 T. Schuster, QM11 K/p Christoph Blume, Dubna Aug. 2012
Summary Part I Beam energy scans at AGS and SPS Produced already a substantial amount of data Baseline for ongoing and future programs Main observations Strong variation of net-baryon density ⇒ change of μB Maximum of relative strangeness production around √sNN = 7-8 GeV Sharp maximum in K+/π+ ratio. Interpretation? Evolution of radial flow changes around √sNN = 7-8 GeV No evidence for critical point yet (first attempts) Christoph Blume, Dubna Aug. 2012