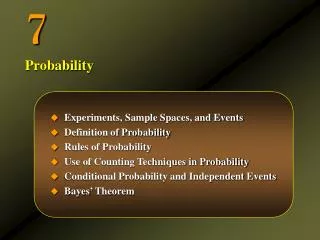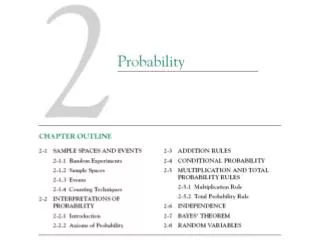
Probability: Sample Spaces, Events, and Counting Techniques
620 likes | 651 Vues
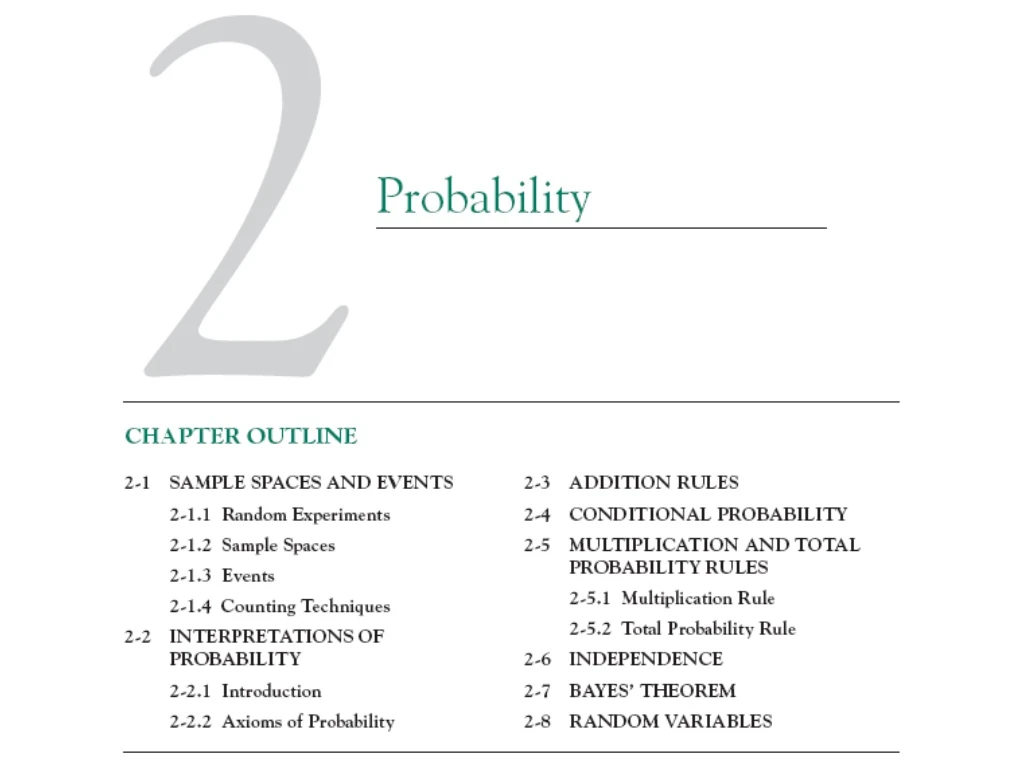
Learn about sample spaces, events, and counting techniques in probability theory. Understand random experiments, noise variables, tree diagrams, permutations, combinations, interpretation of probability, axioms, addition rules, conditional probability, multiplication rule, total probability rule, and more.

Probability: Sample Spaces, Events, and Counting Techniques
E N D
Presentation Transcript
2-1 Sample Spaces and Events 2-1.1 Random Experiments Figure 2-1Continuous iteration between model and physical system.
2-1 Sample Spaces and Events 2-1.1 Random Experiments Figure 2-2Noise variables affect the transformation of inputs to outputs.
2-1 Sample Spaces and Events 2-1.1 Random Experiments Definition
2-1 Sample Spaces and Events 2-1.1 Random Experiments Figure 2-3A closer examination of the system identifies deviations from the model.
2-1 Sample Spaces and Events 2-1.1 Random Experiments Figure 2-4Variation causes disruptions in the system.
2-1 Sample Spaces and Events 2-1.2 Sample Spaces Definition
2-1 Sample Spaces and Events 2-1.2 Sample Spaces Example 2-1
2-1 Sample Spaces and Events Example 2-1 (continued)
2-1 Sample Spaces and Events Example 2-2
2-1 Sample Spaces and Events Example 2-2 (continued)
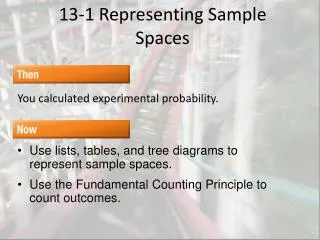
2-1 Sample Spaces and Events Tree Diagrams • Sample spaces can also be described graphically withtree diagrams. • When a sample space can be constructed in several steps or stages, we can represent each of the n1 ways of completing the first step as a branch of a tree. • Each of the ways of completing the second step can be represented as n2 branches starting from the ends of the original branches, and so forth.
2-1 Sample Spaces and Events Figure 2-5Tree diagram for three messages.
2-1 Sample Spaces and Events Example 2-3
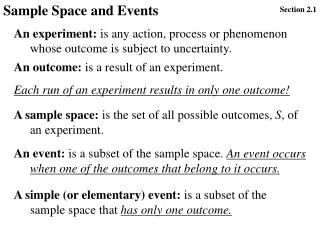
2-1 Sample Spaces and Events 2-1.3 Events Definition
2-1 Sample Spaces and Events 2-1.3 Events Basic Set Operations
2-1 Sample Spaces and Events 2-1.3 Events Example 2-6
2-1 Sample Spaces and Events Definition
2-1 Sample Spaces and Events Venn Diagrams Figure 2-8Venn diagrams.
2-1 Sample Spaces and Events 2-1.4 Counting Techniques Multiplication Rule
2-1 Sample Spaces and Events 2-1.4 Counting Techniques Permutations
2-1 Sample Spaces and Events 2-1.4 Counting Techniques Permutations : Example 2-10
2-1 Sample Spaces and Events 2-1.4 Counting Techniques Permutations of Subsets
2-1 Sample Spaces and Events 2-1.4 Counting Techniques Permutations of Subsets: Example 2-11
2-1 Sample Spaces and Events 2-1.4 Counting Techniques Permutations of Similar Objects
2-1 Sample Spaces and Events 2-1.4 Counting Techniques Permutations of Similar Objects: Example 2-12
2-1 Sample Spaces and Events 2-1.4 Counting Techniques Combinations
2-1 Sample Spaces and Events 2-1.4 Counting Techniques Combinations: Example 2-13
2-2 Interpretations of Probability 2-2.1 Introduction Probability • Used to quantify likelihood or chance • Used to represent risk or uncertainty in engineering applications • Can be interpreted as our degree of belief or relative frequency
2-2 Interpretations of Probability 2-2.1 Introduction Figure 2-10Relative frequency of corrupted pulses sent over a communications channel.
2-2 Interpretations of Probability Equally Likely Outcomes
2-2 Interpretations of Probability Example 2-15
2-2 Interpretations of Probability Figure 2-11Probability of the event E is the sum of the probabilities of the outcomes in E
2-2 Interpretations of Probability Definition
2-2 Interpretations of Probability Example 2-16
2-2 Interpretations of Probability 2-2.2 Axioms of Probability
2-3 Addition Rules Probability of a Union
2-3 Addition Rules Mutually Exclusive Events
2-3 Addition Rules Three Events
2-3 Addition Rules Figure 2-12Venn diagram of four mutually exclusive events
2-3 Addition Rules Example 2-21
2-4 Conditional Probability • To introduce conditional probability, consider an example involving manufactured parts. • Let D denote the event that a part is defective and let F denote the event that a part has a surface flaw. • Then, we denote the probability of D given, or assuming, that a part has a surface flaw as P(D|F). This notation is read as the conditional probability of D given F, and it is interpreted as the probability that a part is defective, given that the part has a surface flaw.
2-4 Conditional Probability Figure 2-13Conditional probabilities for parts with surface flaws
2-4 Conditional Probability Definition
2-5 Multiplication and Total Probability Rules 2-5.1 Multiplication Rule
2-5 Multiplication and Total Probability Rules Example 2-26
2-5 Multiplication and Total Probability Rules 2-5.2 Total Probability Rule Figure 2-15Partitioning an event into two mutually exclusive subsets. Figure 2-16Partitioning an event into several mutually exclusive subsets.
2-5 Multiplication and Total Probability Rules 2-5.2 Total Probability Rule (two events)