Download

1 / 24
240 likes | 600 Vues
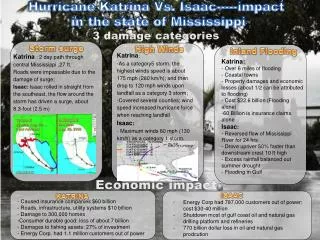
NOAA Hurricane Storm Surge. Judith Gray National Oceanic and Atmospheric Administration Oceanic and Atmospheric Research Atlantic Oceanographic and Meteorological Laboratory November 1, 2005. STORM SURGE: water pushed ashore by the winds around the eye of a hurricane

E N D
NOAA Hurricane Storm Surge Judith Gray National Oceanic and Atmospheric Administration Oceanic and Atmospheric Research Atlantic Oceanographic and Meteorological Laboratory November 1, 2005
STORM SURGE: • water pushed ashore by the winds around the eye of a hurricane • combines with normal tides to create a storm tide that can increase mean water level by 15 feet or more • has historically brought most of the death and destruction during hurricanes, claiming nine of ten victims, and is the primary reason that coastal areas are evacuated as storms approach STORM SURGE: Storm surge has historically brought most of the death and destruction during hurricanes, and is the primary reason that coastal areas are evacuated as storms approach. Howling winds around a hurricane's eye create storm surge by piling water up. In the deep ocean, this dome of water sinks and harmlessly flows away. But as a storm nears land, the rising sea floor blocks the water's escape and it comes ashore as deadly storm surge. An intense hurricane can send a dome of water more than 18 feet deep ashore as the storm hits land. GENERALIZATIONS: • The higher the hurricane’s category, the higher the storm surge. • Maximum storm surge occurs to the right of the storm track, roughly at the radius of max winds.
STORM SURGE STORM SURGE STORM SURGE HIGH TIDE MEAN TIDE (MSL) LOW TIDE DUNE DUNE Tide with Storm Surge
GENERALIZATIONS: • The higher the hurricane’s category, the higher the storm surge. • Maximum storm surge occurs to the right of the storm track, roughly at the radius of max winds. • Faster-moving hurricanes cause higher surges AT THE COASTLINE than do slower-moving hurricanes.
GENERALIZATIONS: • For areas with gentle slopes of the continental shelf, storm surge is large but waves are small. • Areas with deep water just offshore experience large waves, but little storm surge. • Very small, compact hurricanes cause less storm surge than do large-sized hurricanes.
EA AKE SLOSH VERLAND URGE from URRICANES
19. Biscayne Bay • 20. Florida Bay • 21. Charlotte Harbor • 22. Tampa Bay • 23. Cedar Key • 24. Apalachicola Bay • 25. Panama City • 26. Pensacola Bay • 27. Mobile Bay • 28. Mississippi Sound • 29. Lake Pontchatrain/ • New Orleans • 30. Vermilion Bay • 31. Sabine Lake • 32. Galveston Bay • 33. Matagorda Bay • 34. Corpus Christi Bay • 35. Laguna Madre • 36. Oahu, Hawaii • 37. Puerto Rico • 38. Virgin Islands • 39. Guam • 1. Penobscot Bay • 2. Boston Harbor • 3. Naragansett/ • Buzzards Bay • 4. New York/ • Long Island Sound • 5. Delaware Bay • 6. Atlantic City • 7. Ocean City • 8. Chesapeake Bay • 9. Norfolk • 10. Pamilico Sound • 11. Wilmington N.C./ • Myrtle Beach • 12. Charleston Harbor • 13. Savannah/ Hilton Head • 14. Brunswick • 15. Jackson ville • 16. Lake Okeechobee • 17. Cape Canaveral • 18. Palm Beach • Elliptical / Hyperbolic Grid SLOSH BASINS Guam Hawaii Virgin Islands Puerto Rico 35
Data Input to SLOSH Model: Meteorological Bathymetric & Topographic Tide Reference Levels
METEOROLOGICAL INPUT TO SLOSH INTENSITY - (pressure) TRACK Positions - latitude & longitude SIZE - Radius of maximum wind
Hurricane Ivan – Actual Track 30 mi E of Adv 54 Forecast Track
Rmax=25 mi (forecast) Surges based on NHC Advisory 54 for Ivan
Rmax=40 mi Surges based on NHC best track for Ivan
ALABAMA FLORIDA Escambia Santa Rosa MISSISSIPPI Okaloosa Mobile Baldwin Walton Jackson Harrison Hancock Bay ENVELOPE OF HIGH WATER (EOHW)
ALABAMA FLORIDA Escambia Santa Rosa MISSISSIPPI Okaloosa Mobile Baldwin Walton Jackson Harrison Hancock Bay
Evacuation Zones 1. Delineated by major geographic features 2. Conform to existing political or demographic boundaries
Improvements to Storm Surge Forecasting from Improved HURRICANE FORECASTING • TRACK • INTENSITY • SIZE / STRUCTURE
Improvements to Storm Surge Forecasting from Improved STORM SURGE MODELING • ENSEMBLES OF MODELS • PROBABALISTIC FORECASTS • HIGHER RESOLUTION • COUPLING • ADDING WAVES