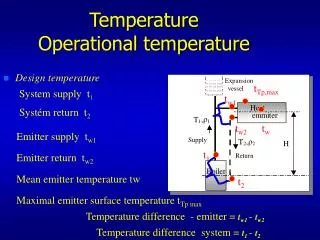
Comprehensive Overview of Oceanographic Dynamics: Temperature, Salinity, and Currents
300 likes | 435 Vues
This document explores key aspects of oceanography, focusing on temperature and salinity profiles from the Levitus dataset, global evaporation-precipitation dynamics, and density variations in relation to temperature and salinity. It highlights the seasonal changes in mixed layer depth, major ocean currents, and the implications of Ekman transport on coastal upwelling. Additionally, it examines the role of the Southern Ocean in global thermohaline circulation and presents models predicting ocean behavior based on temperature and salinity differentials.

Comprehensive Overview of Oceanographic Dynamics: Temperature, Salinity, and Currents
E N D
Presentation Transcript
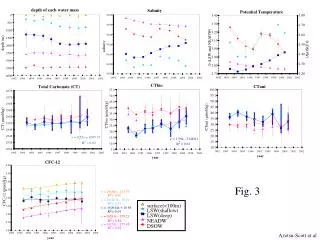
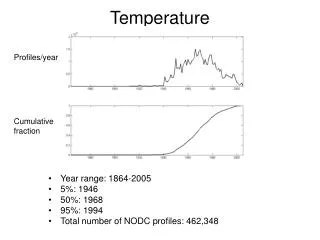
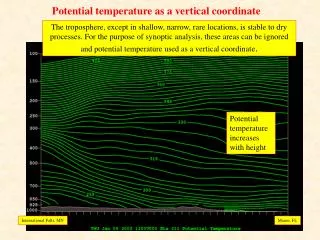
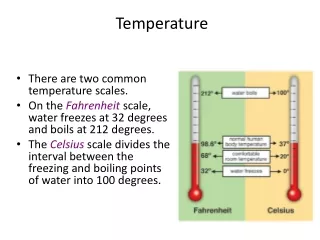
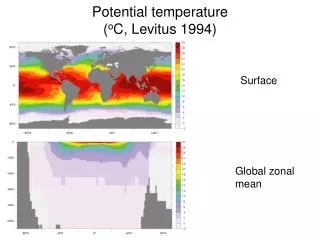
Potential temperature(oC, Levitus 1994) Surface Global zonal mean
Salinity (psu, Levitus 1994) Surface Global zonal mean
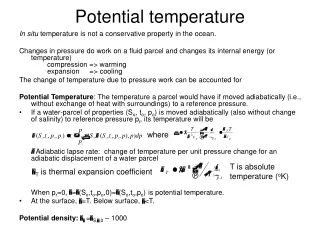
Density as function of temp, salinity and pressure ρ–1000 kg m–3 freezing point max density
Potential density(-1000 kg m–3, Levitus 1994) Surface Global zonal mean
World ocean currents Map shows vertically averaged currents around the world oceans
Western boundary currents: Gulf Stream SST satellite image, from U. Miami RSMAS Benjamin Franklin’s map (Richardson, Science1980)
Surface wind (NCEP, m/s) January July
westerlies trades Observed asymmetry of gyres what one might expect what one observes
World ocean overturning and heat transportResults from a numerical model (Boccaletti et. al 2005) mass flux (Sv) heat flux (PW) 80S 40S Eq 40N 80N
The present perception of Southern Ocean overturning: it makes the global thermohaline circulation possible Lumpkin and Speer (2007) Speer et al., 2000; Sloyan and Rintoul, 2001ab
Mixing is crucial: A scenario with a surface buoyancy forcing of NADW upwelling is problematic Warm sources have to be deeper than cold ones: The Sandström’s theorem NADW Consumption NADW Formation Mixing Intense THC No THC
Mixing is crucial: Different scenarios for the NADW upwelling a) Pushing by deepwater formation c) Pulling by wind stress & surface waves b) Pulling by deep mixing “[…] understanding the physics related to the spatial and temporal distribution of mixing is one of the most important research frontiers in physical oceanography.” Huang (2004)
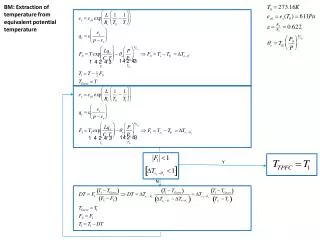
A simple model of the thermohaline circulation temperature difference salinity difference • = flow strength, proportional to density difference , adim. constants
Change in surface temperature 30 years after thermohaline shutdown
Equatorial currents Surface Meridional cross section Equatorial undercurrent