Download
1 / 1
10 likes | 166 Vues
Christopher Lynnes, Bruce Vollmer, Richard Strub, Thomas Hearty Goddard Earth Sciences Data and Information Sciences Center Robert Wolfe, Neal Most, Ali Rezaiyan-Nojani MODIS Adaptive Processing System Peter Fox, Stephan Zednik, Patrick West Tetherless World Constellation, RPI.

E N D
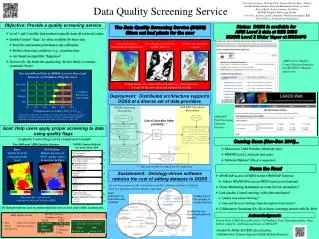
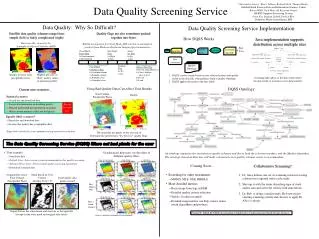
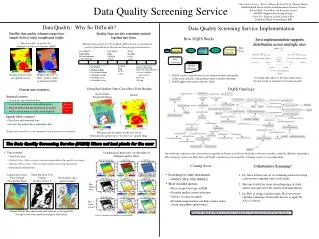
Christopher Lynnes, Bruce Vollmer, Richard Strub, Thomas Hearty Goddard Earth Sciences Data and Information Sciences Center Robert Wolfe, Neal Most, Ali Rezaiyan-Nojani MODIS Adaptive Processing System Peter Fox, Stephan Zednik, Patrick West Tetherless World Constellation, RPI Data Quality: Why So Difficult? Data Quality Screening Service Implementation Satellite data quality schemes range from simple (left) to fairly complicated (right) Quality flags are also sometimes packed together into bytes How DQSS Works Java implementation supports distribution across multiple sites Hurricane Ike, viewed by the Atmospheric Infrared Sounder (AIRS) Bitfield arrangement for Cloud_Mask_SDS variable in atmospheric products from Moderate Resolution Imaging Spectroradiometer End User screened data file Screener quality mask data file Masker Cloud Mask Status Flag 0=Undetermined1=Determined Day/Night Flag 0=Night1=Day Snow/ Ice Flag 0=Yes1=No user selection Quality Ontology Sunglint Flag 0=Yes1=No Cloud MaskCloudiness Flag 0=Confident cloudy 1=Probably cloudy 2=Probably clear 3=Confident clear Surface Type Flag 0=Ocean, deep lake/river 1=Coast, shallow lake or river 2=Desert 3=Land Quality level for total precipitable water Highest pressure of “Best” quality values in moisture profiles • DQSS creates a mask based on user selected criteria and quality fields in the data file, with guidance from a Quality Ontology. • DQSS applies the mask to the data fields Screening takes place at the data center where the data reside to avoid excessive data transfers DQSS Ontology Using Bad Quality Data Can Affect Your Results Current user scenarios... Total Column Precipitable Water Quality • Nominal scenario • Search for and download data • Locate documentation on handling quality • Read & understand documentation on quality • Write custom routine to filter out bad pixels • Equally likely scenario* • Search for and download data • Assume that quality has a negligible effect • *Especially outside the core community of experienced researchers Repeat for each user End Product Best Good Do Not Use kg/m2 The unusually dry pixels on the east side of Hurricane Ike (arrow) have “Do Not Use” quality flags. The Data Quality Screening Service (DQSS) filters out bad pixels for the user Coming Soon... Visualizations help users see the effect of different quality filters • User scenario • Search for data • Default Case: Select science team recommendation for quality screening • Advanced User Case: Select custom quality screening parameters • Download screened data An ontology organizes the variations in quality schemes and drives both the selection interface and the Masker algorithm. The ontology-based architecture will make extension to new quality schemes easier to accommodate. • Screening for other instruments • MODIS, MLS, OMI, HIRDLS • More detailed metrics • Basic usage from logs in EMS • Detailed quality criteria selection • Yields (%values retained) • Detailed usage metrics can help science teams tweak algorithms and products Collaborative Screening? Original Data Array: Total Column Precipitable Water Mask Based on User Criteria (Quality level < 2) Dr. Alice defines one set of screening criteria for using a dataset in a regional water cycle study. She tags it with the terms describing type of study and/or area and saves the criteria with annotations. Dr. Bob is doing a similar study. He browses pre-existing screening criteria and chooses to apply Dr. Alice’s criteria. Good quality data pixels retained Best Quality Only Best +Good Quality Output file has the same format and structure as the input file (except for the extra mask and original data fields) Funded by NASA ACCESS (Accelerating Collaborative Connections for Earth System Science)