Temperature
Temperature. 10. 15. 20. 25. 30. Atmospheric Pressure. 1003. 1005. 1010. 1011. 1014. Calculating Linear Regressions (y = ax + b) on Calculators. Correlation Coefficient: 0.982607368. For ‘SHARP EL-520W’: Enter MODE1 “STAT” Enter 1 “LINE”

Temperature
E N D
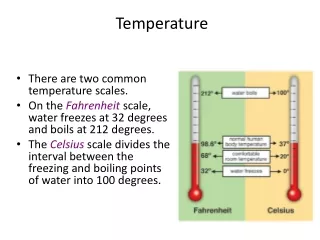
Presentation Transcript
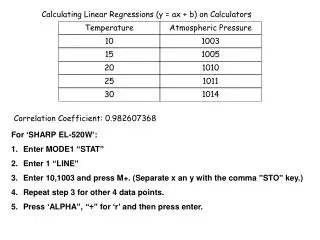
Temperature 10 15 20 25 30 Atmospheric Pressure 1003 1005 1010 1011 1014 Calculating Linear Regressions (y = ax + b) on Calculators Correlation Coefficient: 0.982607368 • For ‘SHARP EL-520W’: • Enter MODE1 “STAT” • Enter 1 “LINE” • Enter 10,1003 and press M+. (Separate x an y with the comma ”STO” key.) • Repeat step 3 for other 4 data points. • Press ‘ALPHA”, “÷” for ‘r’ and then press enter.
Temperature 10 15 20 25 30 Atmospheric Pressure 1003 1005 1010 1011 1014 Calculating Linear Regressions (y = bx + a) on Calculators Equation of regression line: y = 0.56x + 997.4 • For ‘SHARP EL-520W’: • Enter MODE1 “STAT” • Enter 1 “LINE” • Enter 10,1003 and press M+. (Separate x an y with the comma ”STO” key.) • Repeat step 3 for other 4 data points. • Press ‘ALPHA”, “)” for ‘b’ and then press enter. • Press ‘ALPHA”, “(” for ‘a’ and then press enter.