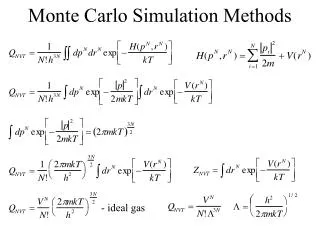
Effective Modeling and Monte Carlo Simulation Techniques
420 likes | 475 Vues
Learn the essentials of computer modeling and Monte Carlo simulation for decision analysis and risk management. Explore when and why to use these methods, different uncertainty distributions, and the importance of approximation. Enhance your skills in modeling tools and understand the classification of models based on uncertainty and time aspects. Discover the significance of deterministic versus stochastic models and the steps involved in designing effective models. Benefit from practical examples and valuable sayings about creating accurate models.

Effective Modeling and Monte Carlo Simulation Techniques
E N D
Presentation Transcript
Modeling and Monte Carlo simulation Marko Tainio Decision analysis and Risk Management course in Kuopio 10.3.2011 Marko Tainio, marko.tainio[at]thl.fi
Content • Computer modeling • Why? • Approximation • When data is not available • Monte Carlo simulation • When and why to use? • Common uncertainty distributions • Normal distribution is not the only option Marko Tainio, marko.tainio[at]thl.fi
Computer modeling Marko Tainio, marko.tainio[at]thl.fi
Modeling Correct Wrong Marko Tainio, marko.tainio[at]thl.fi
Modeling, models • http://en.wikipedia.org/wiki/Mathematical_model • A mathematical model is a description of a system usingmathematical language • The process of developing a mathematical model is termed mathematical modelling (also spelled modeling) • The terms "modeling" and "simulation" are often used interchangeably Marko Tainio, marko.tainio[at]thl.fi
Why models? • Information can be created with measurements and with models • Benefits of modeling in comparison to measurements: • Not everything can be measured (e.g. air pollution concentration all over the country) • Future scenarios can not be measured • Modeling is often cheaper than measurements • Measurements and models are dependent on each other! • Without measurements models are impossible to create • Without modeling, measurement are difficult/impossible to generalize • Measurements and models can be used to design or validate each others Marko Tainio, marko.tainio[at]thl.fi
Classification of models • Based on uncertainty • Deterministic (input and output variables are fixed values) • Stochastic (aka. probabilistic) (at least one of the input OR output variables is probabilistic) • Based on time • Static (time is not taken into account) • Dynamic (time-varying interactions among variables are taken into account) Marko Tainio, marko.tainio[at]thl.fi
Deterministic Input values and the results are based on point values: Model result is always same! For example, laws of physic are deterministic Stochastic Some of input values and model result are based on uncertainty distributions Model result is always a distribution! Most decision analysis models contains uncertainty Deterministic vs. Stochastic Marko Tainio, marko.tainio[at]thl.fi
The general steps when designing models Step 1. Identify the problem. Step 2. Formulate the problem. Step 3. Collect and process data. Step 4. Formulate and develop a model. Step 5. Validate the model. Step 6. Document model for future use. Ref: http://citeseerx.ist.psu.edu/viewdoc/download;jsessionid=4B8162C34D9B9D492158493E25DC8F2C?doi=10.1.1.81.8350&rep=rep1&type=pdf Marko Tainio, marko.tainio[at]thl.fi
Modeling tools • Paper and pencil • Computers are not necessity! • Microsoft Excel and Open Office equivalent • Good and widely used modeling tool • Simulation programs designed for computer modeling • For example R, SAS, Analytica, Matlab, Scilab • Selection of tool depends on available time, money and other features. One tool might not fit to all the situations! Marko Tainio, marko.tainio[at]thl.fi
Sayings about models • “A good model is a judicious tradeoff between realism and simplicity.” • Make things as simple as possible, but not simpler (Albert Einstein) • The good modeler knows when he/she has achieved the correct level of simplicity! • Also, some methods exists to calculate correct level of simplicity Marko Tainio, marko.tainio[at]thl.fi
Approximation Marko Tainio, marko.tainio[at]thl.fi
Approximation • Definition: An approximation is an inexact representation of something that is still close enough to be useful • In decision analysis, risk assessment and computer modeling approximation is necessity • Without approximation assessments would be impossible to complete Marko Tainio, marko.tainio[at]thl.fi
Example of approximation • Case: You need to define fine particulate matter (PM2.5) concentration in Kuopio for year 2008. • You have following information available: • PM2.5 concentration for Jyväskylä (city 100 km west from Kuopio) for year 2008: 8.0 μg/m3 • PM2.5 concentration for Joensuu (city 100 km east from Kuopio) for year 2008: 7.0 μg/m3 • PM2.5 concentration for Kuopio for year 2000: 9.0 μg/m3 • Which one value you would use and why? Marko Tainio, marko.tainio[at]thl.fi
Approximation in calculation of integrals • Integrals are calculated for example when estimating life expectancy of population • The challenge in approximation of integrals are following: • Values are provided only for fixed points (e.g. first of January every year) • Often values for points that were not measured are required! • To calculated the results, modeler needs to approximate the function Marko Tainio, marko.tainio[at]thl.fi
Example with population data Imaginary data on number of people in defined cohort in different ages. The number of people have been calculated 1st of January of each year. ? How many people lived to 52 and half years? Marko Tainio, marko.tainio[at]thl.fi
Example with PM2.5 concentration Marko Tainio, marko.tainio[at]thl.fi
Approximation - summary • Approximation is required in decision analysis and risk assessment • More data you can collect, the better the approximation • The better you understand the problem, the better the approximation Marko Tainio, marko.tainio[at]thl.fi
Monte Carlo simulation Marko Tainio, marko.tainio[at]thl.fi
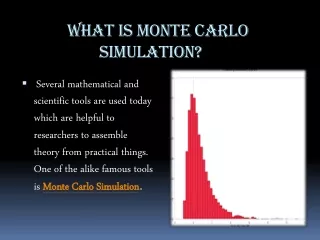
Monte Carlo - definition http://en.wikipedia.org/wiki/Monte_Carlo_simulation • Monte Carlo methods (or Monte Carlo experiments) are a class of computational algorithms that rely on repeated random sampling to compute their results • Monte Carlo methods are often used in simulating physical and mathematical systems • Monte Carlo methods are most suited to calculation by a computer and tend to be used when it is infeasible or impossible to compute an exact result with a deterministic algorithm • In risk & decision analysis, Monte Carlo is the most common way of propagating uncertainty through the model! Marko Tainio, marko.tainio[at]thl.fi
Monte Carlo name? • http://en.wikipedia.org/wiki/Monte_Carlo_simulation • Modern Monte Carlo method was developed in Los Alamos National Laboratory, USA • Los Alamos is famous from The Manhattan Project (atomic bomb) • In late 1940’s the scientists in Los Alamos were faced with problems that could not be solved with analytical calculations • John von Neumann and Stanislaw Ulam suggested that the problem be solved by modeling the experiment on a computer using chance • Being secret, their work required a code name. Von Neumann chose the name "Monte Carlo". • The name is a reference to the Monte Carlo Casino in Monaco where Ulam's uncle would borrow money to gamble. Marko Tainio, marko.tainio[at]thl.fi
Why Monte Carlo? • Monte Carlo allows combination of uncertainties in the model • For example: multiplying of different uncertainties (see next slide) • Analytical method for combination of uncertainties is more complicated or, in some cases, impossible to calculate • Since decision models involves always uncertainties, a method to propagate these uncertainties through the model is needed! Marko Tainio, marko.tainio[at]thl.fi
Variable a x Variable b = Results Normal (1,1) x Lognormal(1,1.2) = Results Normal (1,1) Lognormal (1,1.2) Marko Tainio, marko.tainio[at]thl.fi
Estimation of Pi • The ratio of the area of an inscribed circle to that of the surrounding square is π/4. • Since the two areas are in the ratio π/4, the objects should fall in the areas in approximately the same ratio. Thus, counting the number of objects in the circle and dividing by the total number of objects in the square will yield an approximation for π/4. • Multiplying the result by 4 will then yield an approximation for π itself. Marko Tainio, marko.tainio[at]thl.fi
Iteration of uncertainty function with Monte Carlo Normal distribution with mean of 1 and with standard deviation of 1 Marko Tainio, marko.tainio[at]thl.fi
Critical issues in Monte Carlo • How iteration is done: • Iterations should be independent (non-correlated) from each other; • Creation of random numbers is a science on its own and we will not focus on that issue • How many iterations is required? • More iterations, more computer power is needed • In practice we prefer 10 000 iterations Marko Tainio, marko.tainio[at]thl.fi
Example from # of iterations 10 iterations 100 iterations 1000 iterations 10000 iterations Marko Tainio, marko.tainio[at]thl.fi
Common uncertainty distributions Marko Tainio, marko.tainio[at]thl.fi
Most used uncertainty distributions in our risk models • Bernoulli • Lognormal • Normal • Triangular • Uniform Marko Tainio, marko.tainio[at]thl.fi
Normal distribution The range [mean-standard deviation, mean + standard deviation] encloses about 68% of the probability. Marko Tainio, marko.tainio[at]thl.fi
Normal distribution • Alternative names: Gaussian, Bell-shaped • Most common distribution • Theoretically sum of number of independent events has normal distribution • Properties: • symmetric around the mean • the upper and lower bounds are unknown, possibly very large or very small (unbounded) Marko Tainio, marko.tainio[at]thl.fi
Lognormal distribution The range [median/gsdev, median x gsdev] encloses about 68% of the probability Marko Tainio, marko.tainio[at]thl.fi
Lognormal distribution • Alternative names: log normal, log-normal, Galton distribution. • Also a common distribution: • The multiplicative version of the central limit theorem says that the product or ratio of many independent variables tends to be lognormal — just as their sum tends to a normal distribution. • Properties: • Asymmetric around the mean • the upper bound unknown, possibly very large (unbounded) • Mean and median different! Marko Tainio, marko.tainio[at]thl.fi
Triangular distribution Marko Tainio, marko.tainio[at]thl.fi
Triangular distribution • Properties: • Min, max and mode defined • Mean and median can be same or different • Good to use: • When you want closed boundaries for your distribution • And when you have strong candidate for most likely value (=mode) Marko Tainio, marko.tainio[at]thl.fi
Uniform Marko Tainio, marko.tainio[at]thl.fi
Uniform • Properties: • Min and max defined • Mean and mode same: • (min+max)/2 • Good to use: • When you want closed boundaries for your distribution • When the shape of the distribution is unknown • Random number sampling e.g. in Excel is based on Uniform distribution Marko Tainio, marko.tainio[at]thl.fi
Bernoulli Marko Tainio, marko.tainio[at]thl.fi
Bernoulli • Alternative name: Binomial distribution. • Properties: • Defines a discrete probability distribution with probability p of result 1 and probability (1 - p) of result 0. • “Coin flipping distribution” • Good to use: • When you want to combine two sets of data (e.g. two model results) Marko Tainio, marko.tainio[at]thl.fi
Example of uncertainty distributions • Case: You need to define fine particulate matter (PM2.5) concentration in Kuopio for year 2008. • You have following information available: • PM2.5 concentration for Jyväskylä (city 100 km west from Kuopio) for year 2008: 8.0 μg/m3 • PM2.5 concentration for Joensuu (city 100 km east from Kuopio) for year 2008: 7.0 μg/m3 • PM2.5 concentration for Kuopio for year 2000: 9.0 μg/m3 • Which distribution, and with which parameters, you would use to describe the concentration? Marko Tainio, marko.tainio[at]thl.fi