Module 2: Types of Data
Module 2: Types of Data. This module describes the types of data typically encountered in public health applications. Recognizing and understanding the different data types is an important component of proper data use and interpretation. Reviewed 15 April 2005 /MODULE 2. Data and Variables.

Module 2: Types of Data
E N D
Presentation Transcript
Module 2: Types of Data This module describes the types of data typically encountered in public health applications. Recognizing and understanding the different data types is an important component of proper data use and interpretation. Reviewed 15 April 2005 /MODULE 2
Data and Variables Data are often discussed in terms of variables, where a variable is: Any characteristic that varies from one member of a population to another. A simple example is height in centimeters, which varies from person to person.
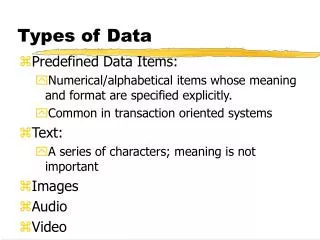
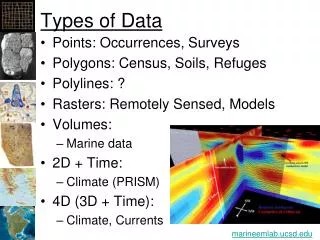
Types of Variables There are two basic types of variables: numerical and categorical variables. Numerical Variables: variables to which a number is assigned as a quantitative value. Categorical Variables: variables defined by the classes or categories into which an individual member falls.
Types of Numerical variables • Discrete: Reflects a number obtained by counting—nodecimal. • Continuous: Reflects a measurement; the number • of decimal places depends on the precision of the measuring device. • • Ratio scale: Order and distance implied. Differences can • be compared; has a true zero. Ratios can be compared. • Examples: Height, weight, blood pressure • • Interval scale: Order and distance implied. Differences • can be compared; no true zero. Ratios cannot be • compared. • Example: Temperature in Celsius.
Categorical Variables Defined by the classes or categories into which an individual member falls. • Nominal Scale: Name only--Gender, hair color, ethnicity • Ordinal Scale: Nominal categories with an implied order--Low, medium, high.
b. Appearance of plasma: b. 1. Clear……………………… 1. 2. Turbid…………………… 2. 9. Not done………………… 9. NOMINAL SCALE
81.Urine protein (dipstick reading): 81. 1. Negative………………… 1. 2. Trace……………………. 2. 3. 30 mg% or +…………… 3. 4. 100 mg% or ++………… 4. 5. 300 mg% or +++………… 5. 6. 1000 mg% or ++++……… 6. If urine protein is 3+ or above, be sure subject gets a 24 hour urine collection container and instruction ORDINAL SCALE
1 2 3 4 5 Very Satisfied Somewhat Satisfied Neutral Somewhat Dissatisfied Very Dissatisfied Likert Scale Question: Compared to others, what is your satisfaction rating of the National Practitioner Data Bank?
Datasets and Data Tables Dataset: Data for a group of variables for a collection of persons. Data Table: A dataset organized into a table, with one column for each variable and one row for each person.
Definitions for Variables • AGE: Age in years • BMI: Body mass index, weight/height2 in kg/m2 • FFNUM: The average number of times eating “fast food” in a week • TEMP: High temperature for the day • GENDER: 1- Female 0- Male • EXERCISE LEVEL: 1- Low 2- Medium 3- High • QUESTION: Compared to others, what is your satisfaction rating of the National Practitioner Data Bank? • 1- Very Satisfied 2- Somewhat Satisfied 3- Neutral • 4- Somewhat dissatisfied 5- Dissatisfied