Minimal Spanning Tree
Minimal Spanning Tree. This is a technique used when we need to connect many places to a system(network). The typical object here is to “span” all the places with minimum distance. Cost would then be minimized.

Minimal Spanning Tree
E N D
Presentation Transcript
Minimal Spanning Tree This is a technique used when we need to connect many places to a system(network).
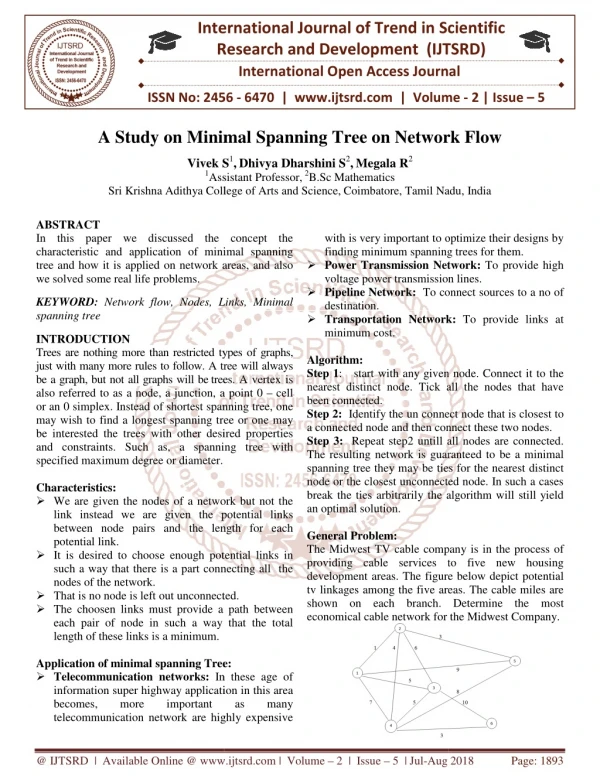
The typical object here is to “span” all the places with minimum distance. Cost would then be minimized. As an example, say we want to hook up all the houses in a neighborhood with a new phone wire. We want to find the order of houses so that when we are finished connecting the houses we have used the least amount of wire. On the next screen I have a map of the house locations and the distances between each. The houses are a geometric shape and have been labeled with a number – the locations are called nodes. The distance between each location is marked and we call each connection between nodes a branch. In the final analysis we do not have to hook-up each distance shown, for we only have to get all connected. As an example we may not have wire between 3 and 7. 7 might be hooked-up from 8.
Node Branch between nodes Distance of Branch 3 5 4 2 3 3 7 7 2 3 1 2 3 2 5 8 4 6 6 1
Qm for windows will solve a problem like this: Go to module -> networks -> File -> new -> Miminum spanning tree Then at input screen put in the number of branches ( I look at the map and cross off a branch when I have counted it – there are 12 on the previous screen.) When you hit OK you will get to the data input. For each branch put in the starting node, ending node and cost. If you do not have cost data, put in distance. The two are correlated. The “Solution Steps” section of the output has the branches used and the cost of the work.
Maximal-Flow This is a technique used to determine the amount that can flow through a system. Each part of the system may not have the same capacity.
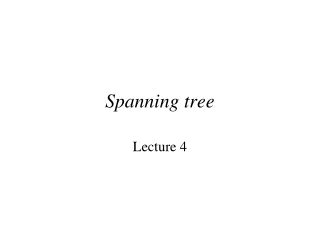
An example here may be that we have a system of streets in a town and we want to know the maximal flow of traffic from west to east that may occur. Another example would be how many gallons of fluid could flow through a system of pipes. Like in the spanning problem, we have nodes (connections), but now we have capacity amounts. The amount that can flow in one direction may not have the same capacity in the reverse direction. In the traffic flow analogy, you could have one lane in the east direction, but two lanes going west. Another difference is that we have to pick a starting node and an ending node in terms of the direction of the flow. Let’s see an example on the next slide.
2 2 2 6 1 1 1 1 1 3 0 2 0 4 1 6 5 1 1 3 10 0 3 2
We will us QM for Windows to solve the problem for us, but let’s consider some of the logic of the solution. We will start at node 1 (source) on the previous slide and move toward node 6 (sink). You will note out of nodes 2, 4 and 3 that a total of 5 can flow toward 6. That will be the final amount through the system here. Sometimes the solution will be such that you will ship toward the intended flow, but because of capacity constraints you will reverse course and take some on a different route. That really isn’t the case in this example, but that could happen.
In QM for windows you will go to module-> networks, file-> new-> maximal flow. Again you have to tell it how many branches there are. We have 9 here. Indicate which node is the source and which node is the sink On each branch you input the staring node, ending node, the capacity flow and the reverse capacity. The “Iterations” section of output will show you each path to the source and how much flowed to the sink.
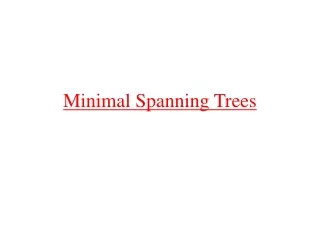
Shortest Route Here we have many ways to get from A to B, but we want the shortest (could mean distance or time) route, because it will cheapest.
200 100 2 4 100 100 50 6 150 1 200 100 5 3 40
We want to get stuff from the plant to the warehouse. We still have nodes and branches and distance or time between nodes. Here you do not want to reverse course and back track because that is costly here. In QM for windows you will go to module-> networks, file-> new-> Shortest route. Again you have to tell it how many branches there are. On each branch you input the staring node, ending node, and the distance or time. Plus you have to say which node is the origin and which is the destination The output section “Network Results” shows the branches used and shows the minimum distance covered.