Download

1 / 31
320 likes | 561 Vues
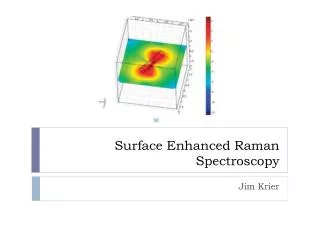
Sum-Frequency Spectroscopy on Bulk and Surface Phonons of a Noncentrosymmetric Crystal. Wei-Tao Liu, Y. Ron Shen Physics Department, University of California at Berkeley. Optical Spectroscopy Techniques for Probing Phonons. Raman. IR. SFS. For bulk and surface phonons.

E N D
Sum-Frequency Spectroscopy on Bulk and Surface Phonons of a Noncentrosymmetric Crystal Wei-Tao Liu, Y. Ron Shen Physics Department, University of California at Berkeley
Optical Spectroscopy Techniques for Probing Phonons Raman IR SFS For bulk and surface phonons
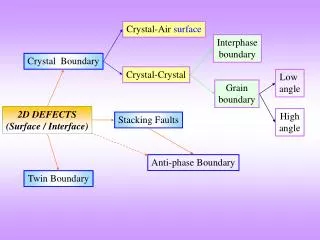
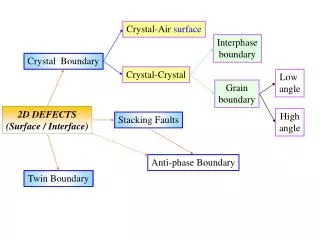
Bulk phonons Bulk structure Surface phonons Surface structure Microscopic surface phonons different from Fuchs-Kliwer surface phonon-polaritons (Re e = -1)
Existing Techniques To Probe Surface Phonons • He scattering: Often limited to < 30 meV • EELS: Difficult for insulating crystals Often probing surface phonon- polaritons • Infrared-visible sum-frequency spectroscopy
Sum-Frequency Spectroscopy 1 2 SF SF 1 2 As 2 q, or el, SFG is resonantly enhanced, Spectroscopic information. 1 2 Measurements with different polarization combinations independent
Experimental Setup s 1, 0.2 -2 To detector and computer 2, 0.42 -10 s
Surface Phonons of Diamond (111)(A Centrosymmetric Crystal) Raman spectrum Pandey model Raman Signal (cm-1) SFG spectrum SF Vis IR
Surface Phonons of Noncentrosymmetric Crystals (21 out of 32 crystallographic point groups are non-centrosymmetric) SF output is overwhelmed by bulk contribution unless can be suppressed, Achievable with selective sample geometry and input/output polarization combination Basic Idea: Surface and Bulk have different structural symmetry.
Example: a-Quartz(0001)(relevant in many areas of science and Technology) Si O Si-OH Si-O-Si D3 point group [0001] Side view Front view
Bulk and Surface Nonlinear Susceptibilities of a-Quartz(0001) W.T.Liu, Y.R.Shen, PRL (2008) 4 Nonvanishing elements of bulk nonlinear susceptibilities: 3 Nonvanishing elements of surface nonlinear susceptibilities for the (0001) surface:
SF Output from (0001) a–Quartz with SSP and PPP Polarization Combinations Bulk contribution dominates unless f ~ 0
Properties of bulk a-quartz SF signal from bulk a-quartz can be suppressed at certain sample orietations. D3 point group
Isotropic Surface modes observed with bulk signal suppressed. a-Quartz (0001) surface: vibration modes • Surface and bulk signals are separable W.-T. Liu and Y. R. Shen, PRL 101, 016101 (2008)
Si-OH Si-O-Si … Si-OH Mode assignment: OTS titration
Effect of Baking SiOH+SiOH SiOSi+H2O
Irreversible surface structural change Quartz Fused Silica SF Intensity • After baking at 500C • Rehydroxylated • After boiled in water 500C baking disrupts the ordered surface lattice structures
Boiling S. Yanina et al., Geochimica 70, 1113 (2006) Deteriorated LEED patterns after 500C F. Bart et al., Surf. Sci 311, L671 (1994)
Bulk Surface Si-O-Si stretch @ 795 cm-1 Si-O-Si stretch @ 870 cm-1 Si-O-Si = 143.7o Si-O-Si ~ 130o Surface structure: Si-O-Si bonding geometry Si-O-Si ~ 120o-135o T. Goumans et al., PCCP 9, 2146 (2007)
Bulk terminated surface q Partially hydrated Surface structure: Si-OH orientation • qMax 30o on partly hydrated a-quartz (0001); • Silanol groups has a broader distribution on fused silica.
Si-OH Si-O-Si Summary • Surface vibrations of non-centrosymmetric crystals can be obtained with SFG; • Example: a-quartz (0001)980 cm-1: Si-OH stretch880 cm-1: (strained) Si-O-Si vibration;
Probing Bulk Phonons Infrared spectroscopy IR active modes Raman spectroscopy Raman active modes SF spectroscopy IR and Raman active modes For a-quartz, only E(TO) modes are both IR and Raman active – 3 out of 11 existing phonon modes between 700 and 1300 cm-1
Raman spectrum SF spectrum
Fitting of the experimental results yields wq = 795, 1064, 1160 cm-1 and the corresponding nonvanishing Aq,aaa ,Aq,bcaAq,cab , Aq,bca = 0,
SF Spectroscopy for Bulk Phonons • Complementary to IR and Raman spectroscopy: Identify modes both IR and Raman active Simple spectrum. • One fixed beam geometry is often sufficient to characterize the detected modes, such as Raman polarizability ratio. • Reflected SF signal comes from a surface layer thickness of reduced wavelength.
IR-visible sum-frequency spectroscopy can be used to probe bulk phonons of crystals, complementary to IR and Raman spectroscopy. It can also be an effective tool to probe surface phonons of crystals with or without inversion symmetry.
Manuel Happy 75th Birthday!