
Phylogenetic Analysis and Tree Construction in Cladistics
E N D
Presentation Transcript
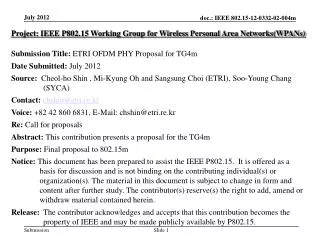
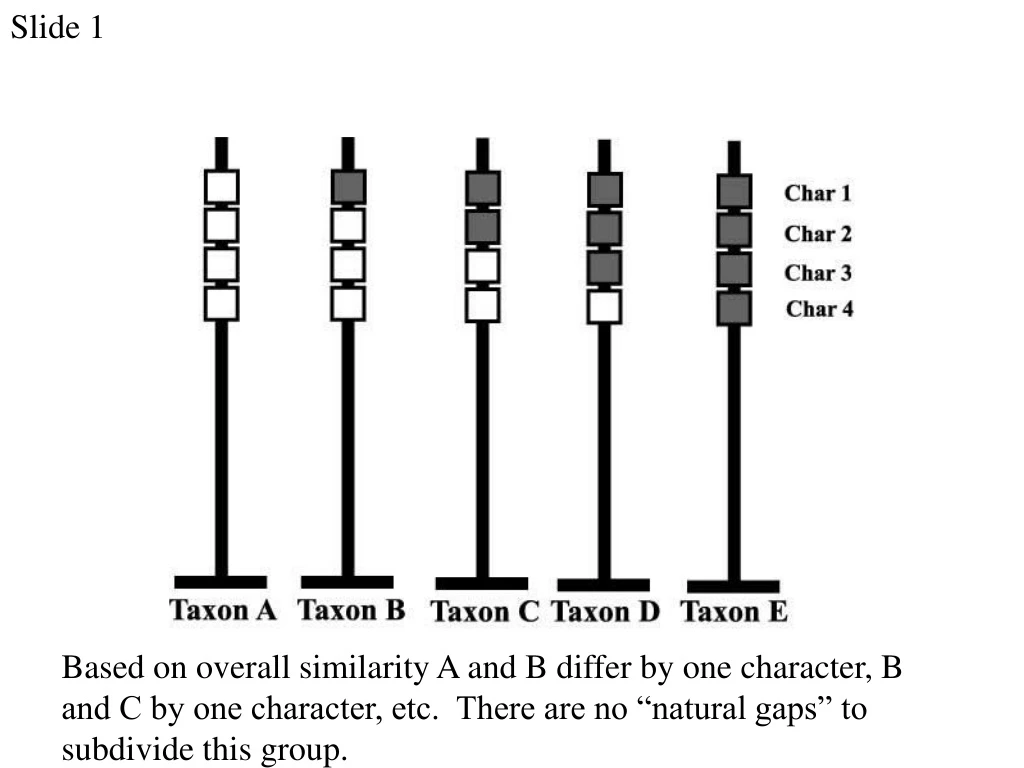
Slide 1 Based on overall similarity A and B differ by one character, B and C by one character, etc. There are no “natural gaps” to subdivide this group.
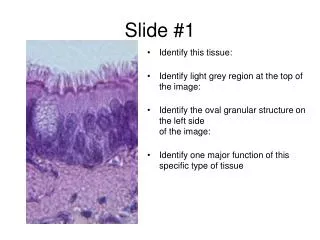
Slide 2 Based on overall similarity, Taxon 3 is more similar to Taxon 1 (they have the same states for 7 characters) than it is to Taxon 5 (they have the same states for only 3 characters).
Slide 3 If the “dark” state is apomorphic (derived) we are only interested in the distribution of these states.
Slide 4 Since we are only interested in synapomorphies (shared derived character states) we remove the autapomorphies (derived state found only in a single object in our study).
Slide 5 If for all 10 characters the dark state is the apomorphic state, then the data suggest that Taxon 3 and Taxon 5 share a common ancestor not shared by Taxon 1. All the other information is uninformative. We assume that the study group shares a common ancestor, so we can now draw the tree for the group. Taxon 1 Taxon 3 Taxon 5
Slide 6 We can now indicate on the tree where all the apomorphic character states evolved on this tree. Char 4 Char 1 Char 2 Char 3 Char 5 Char 6 Char 7 Char 8 Char 9 Char 10 Taxon 1 Taxon 3 Taxon 5
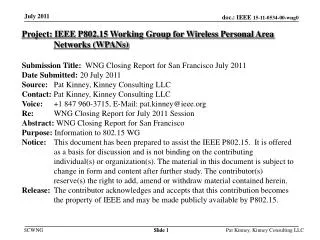
Slide 7 If the dark state is apomorphic, the cladistic analysis suggests a completely resolved tree showing the pattern of shared ancestry. Char 1 Char 2 Char 3 Char 4 Taxon A Taxon B Taxon C Taxon D Taxon E