Download
1 / 12
120 likes | 248 Vues
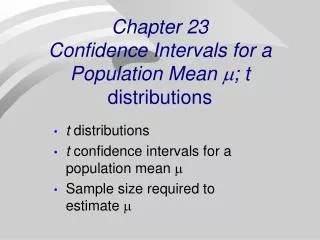
This summary provides insights into the t-test for testing a single population mean (m), covering assumptions, characteristics of the t-distribution, ways to describe the distribution, confidence intervals, hypotheses forms, P-values calculation, and tools like t-probability and t-quantile calculators.

E N D
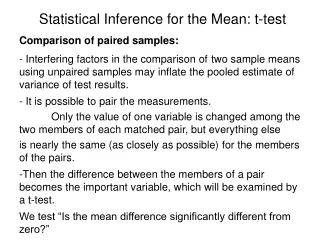
t-Test Statistic • Assumptions: • Population is normal although this assumption can be relaxed if sample size is “large”. • Random sample was drawn from the population of interest.
¥ d f = [ i . e . , N o r m a l ( 0 , 1 ) ] d f = 5 d f = 2 4 2 0 2 4 - - The t-distribution Student(df ) density curves for various df. 1. The t-distribution has one parameter that controls it’s shape called thedegrees of freedom.
¥ d f = [ i . e . , N o r m a l ( 0 , 1 ) ] d f = 5 d f = 2 4 2 0 2 4 - - The t-distribution 2. The Student’s t-distribution is bell shaped and centred at 0 — like the Standard Normal distribution but more variable (larger spread).
¥ d f = [ i . e . , N o r m a l ( 0 , 1 ) ] d f = 5 d f = 2 4 2 0 2 4 - - The t-distribution 3. As df increases, the t-distribution becomes more and more like the standard normal.
¥ d f = [ i . e . , N o r m a l ( 0 , 1 ) ] d f = 5 d f = 2 4 2 0 2 4 - - The t-distribution 4. t-dist (df = ¥) and Normal(0, 1) are two ways of describing the same distribution.
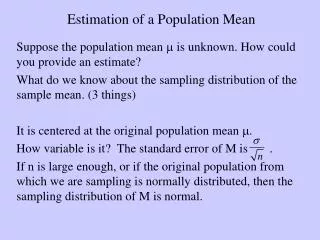
The t-distribution From now on we will treat ashaving at-distribution (df = n - 1). For confidence intervals we will build t-standard-error intervals, estimate ± (t-quantile value) SE(estimate)
The t-distribution Example: P(-1.96 £ Z£ 1.96) = 0.95 (standard normal) P(-2.365 £ t£ 2.365) = 0.95 for t-dist. w/ df = 7 Hence, if we are taking samples of size n = 8 and we want to build intervals that include m for 95% of all samples taken in the long run, then we use
P-value 0 t P-value 0 t t is negative Form of Hypotheses Ho: m = mo HA: m < mo (lower-tail test) Ho: m = mo HA: m > mo (upper-tail test) t is positive P-values are computed by finding areas beneath a t-distribution (df = n – 1)
0 -t t Form of Hypotheses Ho: m = mo HA: m mo (two-tailed test) P-value = Shaded Area t is either pos. or neg. This test is equivalent to constructing a 100(1-a)% CI for m and checking in mois contained in the resulting interval. Reject Ho if the CI does not cover mo.
t-Probability Calculator in JMP Enter test statistic value ( t ) and df in these cells and the tail probabilities will update automatically.
t-Quantile Calculator for CI’s The t-table value or standard error multiplier for the desired confidence level appears here. Enter desired confidence level which is typically 90, 95, or 99.