Download
1 / 81
850 likes | 1.22k Vues
Interfacial friction between soils and solid surfaces. Dr. R. G. Robinson Assistant Professor Department of Civil Engineering IIT Madras. Typical field situations. Shallow foundation. Tip resistance. Deep foundation. Typical field situations. Retaining walls. Typical field situations.

E N D
Interfacial friction between soils and solid surfaces Dr. R. G. Robinson Assistant Professor Department of Civil Engineering IIT Madras
Typical field situations Shallow foundation Tip resistance Deep foundation
Typical field situations Retaining walls
Typical field situations Reinforced earth walls
Typical field situations Geosynthetic reinforced earth slopes
Typical field situations Geotextiles www.geosyntheticssociety.org
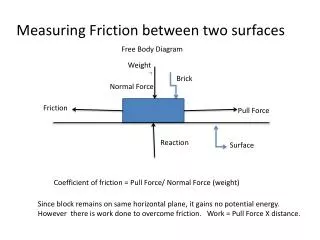
Definition of coefficient of friction and friction angle P P Normal Force T Shear Force Coefficient of friction, m=tand=T/P where, d is the friction angle T Soil Solid material P Shear stress = T/A T Normal stress=P/A
Apparatus used for evaluating friction angle Potyondy (1961) Rowe (1962) Silberman (1961) Ingold (1984) Ingold (1984)
Apparatus used for evaluating friction angle Murthy et al. (1993) Jewell and Wroth (1987) Coyle and Sulaiman (1967)
Apparatus used for evaluating friction angle Brumund and Leonards (1973) Ingold (1984) Heerema (1979) Yoshimi and Kishida (1981)
Apparatus used for evaluating friction angle Desai et al. (1985) Uesugi and Kishida (1986) Paikowsky et al. (1995) Abderrahim and Tisot (1993)
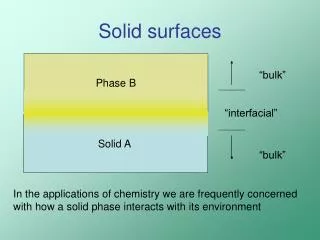
Three Phases in Soils S : Solid Soil particle W: Liquid Water A: Air Air Void ratio, e = Vv/Vs Water content, w = Mw/Ms
Loosest Densest Relative Density (Dr) emax = 0.92 emin = 0.35 (Lambe and Whitman, 1979)
Particle shapes-- Sand Coarse-grained soils Subrounded Rounded Subangular Angular (Holtz and Kovacs, 1981)
Maximum and minimum void ratio ASTM D 4253; ASTM D 4254 Minimum void ratio Maximum void ratio
Direct shear test tf shear strength of soil sn Normal stress c cohesion intercept f angle of internal friction
Typical direct shear test results Dense sand Loose sand f fcv sn1 sn2 sn3 Displacement Displacement sn1 Angle of repose sn2 sn3 Fcv ~ Angle of repose
Factors influencing interfacial friction angle of Sand • Surface Roughness • Density of sand • Normal stress • Rate of deformation • Size of apparatus • Grain size and shape • Type of apparatus
Influence of sand density and surface Roughness Toyoura sand Soma sand
Influence of sand density…… Results of triaxial and soil-steel friction tests (after Noorany, 1985)
Influence of sand density…… Acar et al. 1982 Levacher and Sieffert 1984
Limiting values of d • I Maximum Values: • Potyondy (1961), Panchanathan and Ramaswamy (1964), Uesugi and co-workers reported the limiting maximum value of d is the peak angle of internal friction fp Yoshimi and Kishida (1981) report that the maximum limiting value is the critical state friction angle fcv
Minimum Values of Reported by Various Authors Notes: Particle-to particle friction angle § Ri Modified roundness
Influence of normal stress Potyondy (1961); Acar (1982): Both δ and Φ decreases with normal stress but the ratio (δ/f) remains constant Heerema (1979), Uesugi and Kishida (1986), O’Rourke et al. (1990) d is independent of normal stress For soft materials: d increases with normal stress due to indentation of sand into the material (Panchanathan and Ramaswamy, 1964; Valsangkar and Holm (1997)
Influence of Rate of deformation • Heerema (1979) • Rate of deformation from 0.7 to 600 mm/s • No influence • Lemos (1986) • Rate of deformation 0.0038 to 133 mm/min • No influence
Influence of Size of apparatus • Brumund and Leonards (1973) • Rods with interface area of 225 cm2 and 400 cm2 • No appreciable difference • Uesugi and kishida (1986) • Simple shear apparatus, 40 cm2 and 400 cm2 • No influence • O’Rourke et al (1990) • Direct shear apparatus of size equal to 6cm x 6 cm, 10 cm x10 cm, 28 cm x28 cm and 30.5x30.5 cm • No significant influence
Influence of grain size and shape Rowe (1962) Rowe (1962), Uesugi and Kishida (1986), Jardine and Lahane (1994): d decreases with increase in grain size Friction angle (degrees) Particle diameter (mm) Angular particles give higher friction angle (Uesugi and Kishida 1986; O’Rourke et al. 1990; Paikowski et al. 1995)
Influence of type of apparatus • Kishida and Uesugi (1987) • Simple shear versus direct shear • No difference • Thandavamurthy (1990) • Direct shear versus model pile tests • Direct shear gives 20% higher • Abderrahim and Tisot (1993) • Direct shear- Ring torsion-Pressuremeter probe • Direct shear > Pressuremeter probe >Ring shear
QUANTIFICATION OF INTERFACE ROUGHNESS
Correlation with Normalized Roughness (Kishida &Uesugi 1987)
Definition of modified roundness (Uesugi and Kishida 1986) Modified roundness of a particle
Correlation between m, Rn and R (0.27) (0.19) (0.17)
Analysis of past studies • From the review the following three conclusions can be drawn: • d increases with surface roughness and reaches a maximum limiting value • For very rough surfaces, d tends to a limiting maximum value which could be either the peak angle of internal friction fp or the critical state friction angle fcv. • d can eitherincrease or remain constantwith the increase in sand density.
Schematic of Type A and Type B apparatus Loading cap SAND SAND Material Type A apparatus Type B apparatus
Solid materials used Material 1– Stainless steel
Material 2– Mild steel Material 3– Mild steel
Material 4– Ferrocement Material 5– Ferrocement
Surface profiles of the materials Stainless steel Mild steel Mild steel Concrete surface Concrete surface
Properties of sands used Note: Gs Specific gravity of soil grains (d)max Maximum dry density (d)min Minimum dry density