REFERENCES
CONTACT DETAILS contact: wright@atm.ox.ac.uk Atmospheric, Oceanic and Planetary Physics, Clarendon Laboratory, Parks Road, Oxford OX1 3PU, UK All results based on HIRDLS v2.04.19 (V004). REFERENCES

REFERENCES
E N D
Presentation Transcript
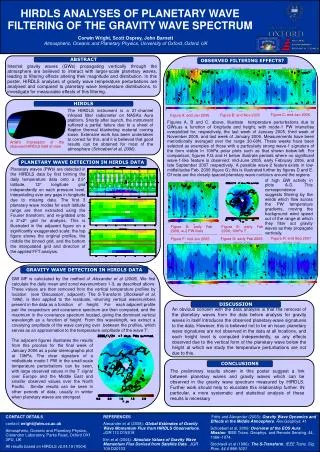
CONTACT DETAILS contact: wright@atm.ox.ac.uk Atmospheric, Oceanic and Planetary Physics, Clarendon Laboratory, Parks Road, Oxford OX1 3PU, UK All results based on HIRDLS v2.04.19 (V004) REFERENCES Alexander et al (2008): Global Estimates of Gravity Wave Momentum Flux from HIRDLS Observations. JGR 113 D15S18 Ern et al (2004): Absolute Values of Gravity Wave Momentum Flux Derived from Satellite Data. JGR 109 D20103 Fritts and Alexander (2003): Gravity Wave Dynamics and Effects in the Middle Atmosphere. Rev.Geophys. 41 Schoeberl et al, 2006: Overview of the EOS Aura Mission. IEEE Trans. Geophys. and Remote Sensing, 44, 1066–1074. Stockwell et al (1996): The S-Transform. IEEE Trans. Sig. Proc. 44 4 998-1001 HIRDLS ANALYSES OF PLANETARY WAVE FILTERING OF THE GRAVITY WAVE SPECTRUM Corwin Wright, Scott Osprey, John Barnett Atmospheric, Oceanic and Planetary Physics, University of Oxford, Oxford, UK ABSTRACT OBSERVED FILTERING EFFECTS? Internal gravity waves (GWs) propagating vertically through the atmosphere are believed to interact with larger-scale planetary waves, leading to filtering effects altering their magnitude and distribution. In this poster, HIRDLS analyses of gravity wave temperature perturbations are analysed and compared to planetary wave temperature distributions, to investigate for measurable effects of this filtering. HIRDLS The HIRDLS instrument is a 21-channel infrared filter radiometer on NASA’s Aura platform. Shortly after launch, the instrument suffered a partial failure due to a sheet of Kapton thermal blanketing material coming loose. Extensive work has been undertaken to correct for this, and it is believed that good results can be obtained for most of the atmosphere (Schoeberl et al, 2006). Figure C: end Jan 2006 Figure B: end Nov 2005 Figure A: end Jan 2005 Figures A, B and C, above, illustrate temperature perturbations due to GWs,as a function of longitude and height, with mode-1 PW intensities overplotted for, respectively, the last week of January 2005, third week of November 2005, and last week of January 2006. Measurements have been meriodionally averaged over the range 30-60N. These weeks have been selected as examples of those with a particularly strong wave-1 signature of the form visible in 10hPa polar plots such as that shown below-left. For comparison, figures F,G and H below illustrate periods where no significant wave-1-like feature is observed: mid-June 2005, early February 2006, and late September 2007 respectively. A possible wave-2 featureexists in low-midlatitudes Feb. 2006 (figure G):this is illustrated further by figures D and E. Of note are the closely-spaced planetary wave contours around the regions Artist’s impression of the obscured HIRDLS field of view PLANETARY WAVE DETECTION IN HIRDLS DATA Planetary waves (PWs) are detected in the HIRDLS data by first binning the daily temperature data onto a 2.5° latitude, 12° longitude grid independently on each pressure level, interpolating over any gaps in longitude due to missing data. The first 3 planetary wave modes for each latitude range are then extracted using the Fourier transform, and re-gridded onto a 2°x2° grid for analysis. This is illustrated in the adjacent figure on a significantly exaggerated scale: the top figure shows the original profiles, the middle the binned grid, and the bottom the interpolated grid and direction of the applied FFT analysis. of high GW activity in plots A-D. This correspondence suggests filtering by the winds which flow across the PW temperature gradients, moving the background wind speed out of the range at which they filter out gravity waves as they propagate vertically. Figure D: early Feb 2006, w-2 PW lines Figure E: early Feb 2006, 10hPa T’ Figure H: end Sep 2007 Figure G: early Feb 2006 Figure F: mid Jun 2005 GRAVITY WAVE DETECTION IN HIRDLS DATA GW MF is calculated by the method of Alexanderet al (2008). We first calculate the daily mean and zonal wavenumbers 1-3, as described above. These values are then removed from the vertical temperature profiles by location (see ‘Discussion’, adjacent).The S-Transform (Stockwell et al, 1996), is then applied to the residuals, returning vertical wavenumbers present in the data as a function of height. For each adjacent profile pair the cospectrum and covariance spectrum are then computed, and the maximum in the covariance spectrum located, giving the dominant vertical wavelength as a function of height. From this wavelength, we extract a covarying amplitude of the wave carrying over between the profiles, which serves as an approximation to the temperature amplitude of the wave T’. DISCUSSION An obvious concern with the data analysis is that the removal of the planetary waves from the data before analysis for gravity waves in itself introduces the observed planetary-wave signatures to the data. However, this is believed not to be an issue: planetary wave signatures are not observed in the data at all locations, and each height level is computed independently, so any effects observed due to the vertical form of the planetary wave below the height at which we study the temperature perturbations are not due to this. The adjacent figures illustrates the results from this process for the final week of January 2006 as a polar stereographic plot at 10hPa. The clear signature of a midlatitude mode-1 PW in the small-scale temperature perturbations can be seen, with large observed values in the T’ signal over Europe and the Middle East and smaller observed values over the North Pacific. Similar results can be seen in other periods of data, usually in winter when planetary waves are strongest. CONCLUSIONS The preliminary results shown in this poster suggest a link between planetary waves and gravity waves which can be observed in the gravity wave spectrum measured by HIRDLS. Further work should help to elucidate this relationship further. IN particular, a more systematic and statistical analysis of these results is necessary