Download
1 / 82
830 likes | 1.01k Vues
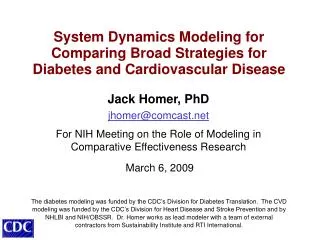
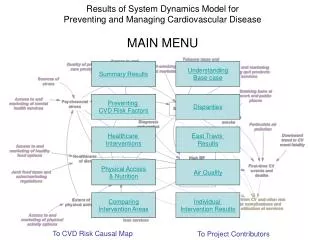
Results of System Dynamics Model for Preventing and Managing Cardiovascular Disease MAIN MENU. Summary Results. Understanding Base case. Preventing CVD Risk Factors. Disparities. Healthcare Interventions. East Travis Results. Physical Access & Nutrition. Air Quality. Comparing

E N D
Results of System Dynamics Model for Preventing and Managing Cardiovascular DiseaseMAIN MENU Summary Results Understanding Base case Preventing CVD Risk Factors Disparities Healthcare Interventions East Travis Results Physical Access & Nutrition Air Quality Comparing Intervention Areas Individual Intervention Results To CVD Risk Causal Map To Project Contributors
A Base Case Scenario for Comparison Assumptions for Input Time Series through 2040 Total RF Complication Costs per Capita 3,000 • A plausible and straightforward scenario • Assume no further changes in contextual factors affecting risk factor prevalences • Any changes in prevalences after 2004 are due to “bathtub” adjustment process and population aging • Provides an easily-understood basis for comparisons • Prior to 2004, model reflects declining … • Fraction workplaces allowing smoking (1990-2003) • Air pollution (1990-2001) • CV event fatality (1990-2003) • Youth smoking (rise 1991-99, decline 1999-2003) 2,000 No Further Changes in Drivers 1,000 Complication Costs per 1000 if all risk factors = 0 0 1990 2000 2010 2020 2030 2040 • Also note: Cost minimum if all proximal risk factor prevalences were zero. More results Base case
Base run behaviors • Result: Past trends level off after 2004, after which results reflect only slow “bathtub” adjustments in risk factors • Increasing obesity, high BP, and diabetes • Decreasing smoking • High cholesterol mixed bag by age/sex, flat overall • Increases in risk factors and population aging lead to eventual rebound in deaths CV Risk Factor Prevalences 30 0.6 High Cholesterol Prevalence High BP Prevalence 0.3 15 (Air pollution only) Air Pollution PM2.5 Smoking Prevalence Diabetes Prevalence 0 0 1990 2000 2010 2020 2030 2040 CVD & Risk Factor Complication Costs and CVD Mortality Obese Adults 4 3,000 Deaths from CVD per 1000 Newly obese adults Becoming non-obese or dying 3 2,250 Complication Costs per 1000 % Obese 2 1,500 0.4 Deaths from CVD per 1000 if all risk factors = 0 1 750 Complication Costs per 1000 if all risk factors = 0 0 2040 1990 0 0 1990 2000 2010 2020 2030 2040 Next Base case Result Previous Base case Result
Base case behavior for 1990-2040 0.3 1 0.3 Stress Prevalence Use of Primary Care Services 0 0 Smoking Prevalence 0.6 0 30 mcg per m3 Particulate Air Pollution PM2.5 Secondhand Smoke Exposure 0 0 1.5 Uncontrolled CV event fatality multiplier 0 Prevalences 0.8 0.6 Poor Diet Fraction High cholesterol 4 0.4 CVD Deaths per 1000 0 0.3 Obesity Prevalence 0 High BP 0 Diabetes Age 65+ fraction of the population 0 0 3,000 0.8 CVD & Risk factor costs per capita Inadequate Physical Activity 0 0 Previous Base case Result
Intervention Options Area of effect and type of intervention • Increasing access • Marketing of services • Social marketing • Taxes and/or sales restriction • Others More results Adult population
Interpreting Cost Results Complication & Management Costs per Capita • Complication costs are for CV and non-CV related complications, both direct and indirect • Management costs include • Annual costs for services provided • Medication costs • When these costs are less than baseline, the difference is the per capita health cost savings per year – the maximum economically justifiable spending for the intervention 3,000 Base Case Increased Access to Physical Activity options * 2,000 1990 2000 2010 2020 2030 2040 Average annual savings of *$ 49 per capitafrom interventions to increase access to physical activity options from 2010 - 2040. Next Adult Population Result Previous Adult Pop Result
4 19.3% Base Case 20.3% 3,000 2 All 19 Interventions with range of uncertainty 2,000 Deaths from CVD if all risk factors = 0 0 1,000 1990 2000 2010 2020 2030 2040 0 12.3% Base Case 23.0% All 19 Interventions with range of uncertainty Complication costs if all risk factors = 0 1990 2000 2010 2020 2030 2040 Sensitivity range for all interventions Deaths from CVD per 1000 % Decrease from Base case CV & Risk Factor ComplicationCosts per Capita There are significant gains even at the least effective end of the uncertainty range. Next Adult Population Result Previous Adult Pop Result
Impact of Multiple Intervention Areas on Adult Population % Change vs. Base Run • Three areas of interventions together provide • 80-90% of benefit of all beneficial interventions in short-term, • 70-80% in long term. Primary Care interventions: • Increase the quality of primary care from 54% to 75% • Increase primary care services marketing from 0 to 100% • Increase access to primary care from 84% to 100% • Tobacco interventions • Tobacco tax and sales restriction from 50% to 100% • Social marketing against smoking from 0 to 100% • Smoke quit services marketing from 0 to 100% • Access to smoke quit services from 50% to 100% • Air Quality interventions • Air pollution cut to half of existing • Workplaces allowing smoking cut to zero Next Adult Population Result Previous Adult Pop Result
Intervention Results for All Adults Deaths from CVD per 1000 4 Base case PC3 + AirQ2 • Intervention areas are: • Primary care • Primary care + Air quality • Primary care + Air quality + Tobacco • All 15 beneficial interventions • Note increasing cost gains over time, for Tobacco and remaining six interventions: • Physical activity • Nutrition • Stress PC3 Beneficial 15 2 PC3 + AirQ2 + Tob4 If all risk factors = 0 0 1990 2000 2010 2020 2030 2040 Complication & Management Costs per Capita 2,000 PC3 + AirQ2 PC3 Base case Average annual cost savings of $ 351 per capita For PC + AQ + Tob 1,000 Beneficial 15 PC3 + AirQ2 + Tob4 If all risk factors = 0 Next Adult Population Result 0 Previous Adult Pop Result 1990 2000 2010 2020 2030 2040
Effects of Interventions on Preventable Deaths (2010-2040 cumulative) Cumulative deaths 2010-2040 (in non-CVD population) from CV and other risk factor complications, in millions From From Other CV Complications Combined Base 19.59 18.72 48.18 PC3 17.74 18.34 45.94 PC3AirQ2 17.11 18.22 45.19 PC3AirQ2Tob4 16.62 14.78 41.26 All19 16.06 14.42 40.34 6.92 million lives saved due to primary care, air quality & tobacco interventions 1.85 m 0.63 m 3.44 m 0.49 m Over 30 years, the “Tob4” intervention cluster reduces CV deaths by 0.5m, and reduces other deaths (cancers & respiratory) by 3.4m, for a total reduction of 3.9m. Primary care reduces CV deaths by 1.8 m. Note that the CV deaths are based on the Framingham methodology, whereas the smoking-related deaths from other complications are based on the SAMMEC methodology. Next Adult Population Result Previous Adult Pop Result
Quick two interventions: Increase Primary Care Quality from 54% to 75% Cut Air Pollution by half Long three interventions: Increase Social Marketing Against Tobacco from 0 to 100% of maximum. Increase Tobacco Tax and Sales Restrictions from 50% to 100% Increase Access to Physical Activity from 70% to 100% These five interventions provide: ~ 77% of cost reduction achieved by 15 interventions, and ~ 57% of mortality reduction 57% 100% 77% 100% Interventions for immediate and longer term effects Deaths from CVD per 1000 4 Base Case Quick two Beneficial 15 2 Quick two + Long three If all risk factors = 0 0 2040 1990 2000 2010 2020 2030 Complication & Management Costs per Capita 3,000 Quick two Base Case Quick two + Long three 1,000 Beneficial 15 Average annual cost savings of $ 350 per capita For Quick 2 + Long 3 0 Previous Adult Pop Result If all risk factors = 0 1990 2000 2010 2020 2030 2040
Healthcare Infrastructure Intervention Effects Deaths from CVD per 1000 4 Base case PC3 + SQ2 + MH2 PC3 • Intervention areas are: • Primary Care • PC plus Smoke Quit Services • PC plus SQ plus Mental Health Services • PC plus SQ plus MH plus Weight Loss Services • Primary Care has greatest impact on mortality but also has substantial cost. • Risk factor treatment costs are based on MEPS data and are medication and oversight. PC3 + SQ2 2 PC3 + SQ2 + MH2 + WL2 Deaths if all risk factors = 0 0 1990 2000 2010 2020 2030 2040 Risk Factor Management Costs per Capita 1,000 PC3 + SQ2 + MH2 + WL2 PC3 + SQ2 + MH2 PC3 + SQ2 500 PC3 Base case More results Healthcare Infrastructure 0 1990 2000 2010 2020 2030 2040
Cardiovascular & Risk factor complication cost savings are greater than increases in ongoing RF management costs. This presents opportunities for innovative implementation options. Primary Care infrastructure interventions Cost differences from Base case Economically justifiable level of investment per capita: $24 over 30 years Next Healthcare Infrastructure Result Previous Healthcare Infrastructure Result
Primary Care Infrastructure Intervention Effects CV & RF Complication Costs per 1000 3,000 • Increasing Primary Care Quality primarily increases treatment - the diagnosis and control of high BP, high cholesterol, and diabetes – targeting the 84% of the population who have access to primary care. • Increasing Access to Primary Care provides healthcare options to the 16% without coverage. Base case Quality of Primary Care Quality + Access to Primary Care Quality + Access + Marketing of Primary Care Complication costs if all risk factors=0 0 1990 2000 2010 2020 2030 2040 Risk Factor Management Costs per Capita 1,000 Quality + Access + Marketing of Primary Care Uncontrolled High BP Controlled High BP Quality + Access to Primary Care High BP onset Treatment Quality of Primary Care 500 CV events or dying CV events or dying Base case 0 Next Healthcare Infrastructure Result Previous Healthcare Infrastructure Result 1990 2000 2010 2020 2030 2040
Why some interventions may not be cost effective for CV endpoints • When considering • medical management costs • CV and non-CV complication cost savings • CV benefits only • With respect to CV endpoints, mental health interventions are quite costly and provide little CV benefit. • Additionally, weight loss interventions increase costs overall and provide little CV benefit. • However, there may be other compelling reasons for these interventions. Complication + Management Costs per Capita 3,000 PC3 + SQ2 + MH2 + WL2 PC3 + SQ2 + MH2 Base case PC3 PC3 + SQ2 PC – Primary care SQ – Smoke quit MH – Mental health WL – Weight loss If all risk factors were = 0 0 1990 2000 2010 2020 2030 2040 Next Healthcare Infrastructure Result Previous Healthcare Infrastructure Result
Base case behaviors and 15 Beneficial interventions 1990-2040 1 0.3 Use of Primary Care Services 0.3 0 Stress Prevalence Smoking Prevalence 0 0.6 0 30 0.6 Air Pollution PM2.5 Secondhand Smoke Exp. mcg per m3 High BP Diabetes 0 0 High cholesterol 1.5 0 Uncontrolled CV event fatality multiplier Control rates 0 Prevalences 0.8 0.5 High cholesterol Poor Diet Fraction 4 0.4 0 CVD Deaths per 1000 0.3 High BP 0 Obesity Prevalence 0 Diabetes Age 65+ fraction of the population 0 0 0.8 3,000 Inadequate Physical Activity CVD & Risk factor costs per capita 0 0 Previous Health Infrastructure Results
Baseline CV Risk Factors CV Risk Factor Prevalences 30 0.6 • Historical trends through 2003 of particular concern: • Obesity • High BP • Diabetes • Future trajectories represent no change in contextual factors, and are not predictive. Uncontrolled High Cholesterol Prevalence 0.3 15 (Air pollution only) Air Pollution PM2.5 Uncontrolled High BP Prevalence Smoking Prevalence Uncontrolled Diabetes Prevalence 0 0 1990 2000 2010 2020 2030 2040 More CV Risk Factor Prevalences 0.6 0.4 Obesity Prevalence Stress Prevalence 0.2 Fraction Nonsmokers SHS Exposure 0 1990 2000 2010 2020 2030 2040 More results Risk Factor Reduction
No Data <4% 4%-6% 6%-8% 8%-10% >10% Diabetes Trends* Among Adults in the U.S.,(Includes Gestational Diabetes)BRFSS 1990 Source: Mokdad et al., Diabetes Care 2000;23:1278-83.
No Data <4% 4%-6% 6%-8% 8%-10% >10% Diabetes Trends* Among Adults in the U.S.,(Includes Gestational Diabetes)BRFSS 1991-92 Source: Mokdad et al., Diabetes Care 2000;23:1278-83.
No Data <4% 4%-6% 6%-8% 8%-10% >10% Diabetes Trends* Among Adults in the U.S.,(Includes Gestational Diabetes)BRFSS 1993-94 Source: Mokdad et al., Diabetes Care 2000;23:1278-83.
No Data <4% 4%-6% 6%-8% 8%-10% >10% Diabetes Trends* Among Adults in the U.S.,(Includes Gestational Diabetes)BRFSS 1995-96 Source: Mokdad et al., Diabetes Care 2000;23:1278-83.
No Data <4% 4%-6% 6%-8% 8%-10% >10% Diabetes Trends* Among Adults in the U.S.,(Includes Gestational Diabetes)BRFSS 1995 Source: Mokdad et al., Diabetes Care 2000;23:1278-83.
No Data <4% 4%-6% 6%-8% 8%-10% >10% Diabetes Trends* Among Adults in the U.S.,(Includes Gestational Diabetes)BRFSS 1997-98 Source: Mokdad et al., Diabetes Care 2000;23:1278-83.
No Data <4% 4%-6% 6%-8% 8%-10% >10% Diabetes Trends* Among Adults in the U.S.,(Includes Gestational Diabetes)BRFSS 1999 Source: Mokdad et al., Diabetes Care 2001;24:412.
No Data <4% 4%-6% 6%-8% 8%-10% >10% Diabetes Trends* Among Adults in the U.S.,(Includes Gestational Diabetes)BRFSS 2000 Source: Mokdad et al., J Am Med Assoc 2001;286:10.
No Data <4% 4%-6% 6%-8% 8%-10% >10% Diabetes Trends* Among Adults in the U.S.,(Includes Gestational Diabetes)BRFSS 2001 Source: Mokdad et al., J Am Med Assoc 2001;286:10. Back to Risk Factor Results
Hypertension Statistics Percent of Adults With Hypertension 1999–2002 • And … • Almost one third of the people with high blood pressure don't know that they have it. • About 28% of American adults have prehypertension. • Hypertension and its complications will continue to increase given these facts. Other Hypertension stats Back to Risk Factor Results Source:Health, United States, 2005.
Fraction of people ever told they had high blood pressure, 2003 Back to Risk Factor Results Source: CDC, Behavioral Risk Factor Surveillance System.
Obesity Trends* Among U.S. AdultsBRFSS, 1990 (*BMI ≥30, or ~ 30 lbs. overweight for 5’ 4” person) No Data <10% 10%–14%
Obesity Trends* Among U.S. AdultsBRFSS, 1991 (*BMI ≥30, or ~ 30 lbs. overweight for 5’ 4” person) No Data <10% 10%–14% 15%–19%
Obesity Trends* Among U.S. AdultsBRFSS, 1992 (*BMI ≥30, or ~ 30 lbs. overweight for 5’ 4” person) No Data <10% 10%–14% 15%–19%
Obesity Trends* Among U.S. AdultsBRFSS, 1993 (*BMI ≥30, or ~ 30 lbs. overweight for 5’ 4” person) No Data <10% 10%–14% 15%–19%
Obesity Trends* Among U.S. AdultsBRFSS, 1994 (*BMI ≥30, or ~ 30 lbs. overweight for 5’ 4” person) No Data <10% 10%–14% 15%–19%
Obesity Trends* Among U.S. AdultsBRFSS, 1995 (*BMI ≥30, or ~ 30 lbs. overweight for 5’ 4” person) No Data <10% 10%–14% 15%–19%
Obesity Trends* Among U.S. AdultsBRFSS, 1996 (*BMI ≥30, or ~ 30 lbs. overweight for 5’ 4” person) No Data <10% 10%–14% 15%–19%
Obesity Trends* Among U.S. AdultsBRFSS, 1997 (*BMI ≥30, or ~ 30 lbs. overweight for 5’ 4” person) No Data <10% 10%–14% 15%–19% ≥20%
Obesity Trends* Among U.S. AdultsBRFSS, 1998 (*BMI ≥30, or ~ 30 lbs. overweight for 5’ 4” person) No Data <10% 10%–14% 15%–19% ≥20%
Obesity Trends* Among U.S. AdultsBRFSS, 1999 (*BMI ≥30, or ~ 30 lbs. overweight for 5’ 4” person) No Data <10% 10%–14% 15%–19% ≥20%
Obesity Trends* Among U.S. AdultsBRFSS, 2000 (*BMI ≥30, or ~ 30 lbs. overweight for 5’ 4” person) No Data <10% 10%–14% 15%–19% ≥20%
Obesity Trends* Among U.S. AdultsBRFSS, 2001 (*BMI ≥30, or ~ 30 lbs. overweight for 5’ 4” person) No Data <10% 10%–14% 15%–19% 20%–24% ≥25%
Obesity Trends* Among U.S. AdultsBRFSS, 2002 (*BMI ≥30, or ~ 30 lbs. overweight for 5’ 4” person) No Data <10% 10%–14% 15%–19% 20%–24% ≥25%
Obesity Trends* Among U.S. AdultsBRFSS, 2003 (*BMI ≥30, or ~ 30 lbs. overweight for 5’ 4” person) No Data <10% 10%–14% 15%–19% 20%–24% ≥25%
Obesity Trends* Among U.S. AdultsBRFSS, 2004 (*BMI ≥30, or ~ 30 lbs. overweight for 5’ 4” person) No Data <10% 10%–14% 15%–19% 20%–24% ≥25%
Obesity Trends* Among U.S. AdultsBRFSS, 2005 (*BMI ≥30, or ~ 30 lbs. overweight for 5’ 4” person) No Data <10% 10%–14% 15%–19% 20%–24% 25%–29% ≥30%
Obesity Trends* Among U.S. AdultsBRFSS, 2006 (*BMI ≥30, or ~ 30 lbs. overweight for 5’ 4” person) No Data <10% 10%–14% 15%–19% 20%–24% 25%–29% ≥30% Back to Risk Factor Results
Effects of Intervention Areas on High BP • Decreasing Tobacco use increases uncontrolled High BP – due to stress related eating! • Primary care interventions have a major immediate impact. • Physical Activity and other interventions take longer to reduce uncontrolled prevalence, but have increasing improvement over time. • Other chronic conditions have similar pattern. Uncontrolled High Blood Pressure Prevalence 0.25 Tobacco Base case Weight Loss 0.2 Stress Physical Activity 0.15 Primary Care 0.1 1990 2000 2010 2020 2030 2040 Next Risk Factor Results Previous Risk Factor Results
Base case 0.1 Quality of Primary Care Quality + Access to Primary Care Quality + Access + Marketing Primary care intervention effects on proximal risk factors • An example of synergy: • Increasing Quality of Primary Care increases both diagnosis and control rates for all those receiving care. • Increasing Access to Primary Care provides the option to those having higher morbidity. • Together, they provide more effective care to a larger population. Uncontrolled High BP Prevalence Uncontrolled High Cholesterol 0.3 0.6 0.2 0.3 0.1 0 0 1990 2040 1990 2040 Adults with Access to Primary Care Uncontrolled Diabetes Prevalence Smoking Prevalence 0.3 0.08 0.2 0.04 0.1 0 0 1990 2000 2010 2020 2030 2040 2040 1990 2000 2010 2020 2030 Next Risk Factor Result Previous Risk Factor Result Please note different y-axis scaling. Different risk factors have different prevalences.
Implications of interventions to decrease risk factors Uncontrolled High Blood Pressure Prevalence 0.25 Tobacco Uncontrolled High BP Controlled High BP Base case 2. 1. • Primary care interventions increase diagnosis and treatment – so people live longer and total prevalence increases. • Physical activity, weight loss and stress reduction reduce high BP onset, reducing the total prevalence, albeit slowly. Weight Loss High BP onset Treatment 0.2 Stress Physical Activity CV events or dying CV events or dying 0.15 Primary Care 0.1 1990 2000 2010 2020 2030 2040 High BP Prevalence (Controlled + Uncontrolled) 0.4 Primary Care Tobacco 1. Base case 2. Physical Activity 0.3 Stress Weight Loss 0.2 Next Risk Factor Result Previous Risk Factor Result 1990 2000 2010 2020 2030 2040
Investment in interventions to decrease risk factors Uncontrolled High Blood Pressure Prevalence 0.25 Tobacco Base case • Accounting for • Medical management costs • CV and non-CV complication cost savings • Better intervention opportunities to reduce high blood pressure, high cholesterol, and diabetes are: • Primary care • Physical activity • Stress reduction • Tobacco interventions increase chronic conditions a bit, but are very cost effective for smoking and CV endpoints. Weight Loss 0.2 Stress Physical Activity 0.15 Primary Care 0.1 1990 2000 2010 2020 2030 2040 Complication + Management Costs per Capita 3,000 Base case Primary Care 2,500 Stress Weight Loss Physical Activity 2,000 Tobacco Previous Risk Factor Result 1,500 1990 2000 2010 2020 2030 2040