Statistical Analysis of In Vitro AC50 Values and Dosimetry-Adjusted Oral Equivalents for Toxicity Prediction
30 likes | 147 Vues
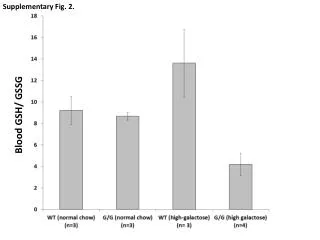
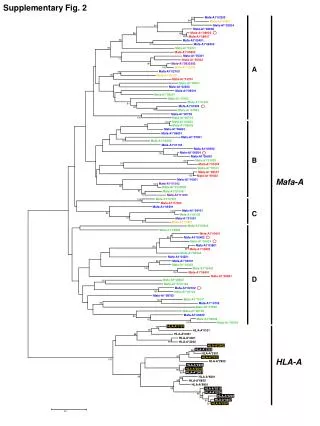
This study presents box and whisker plots illustrating the mean performance metrics derived from the assessment of in vitro AC50 values and dosimetry-adjusted oral equivalent values. These metrics, including mean absolute error and root mean squared error (RMSE), were evaluated across 28 continuous in vivo toxicity endpoints using 40 SAS statistical classification models. Details of the models can be found in Supplementary Table 8, while full names for the in vivo endpoints are in Supplementary Table 7. The findings contribute valuable insights into toxicity prediction models.

Statistical Analysis of In Vitro AC50 Values and Dosimetry-Adjusted Oral Equivalents for Toxicity Prediction
E N D
Presentation Transcript
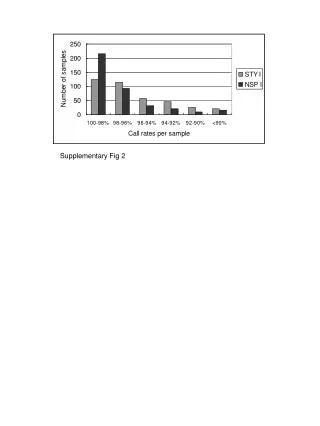
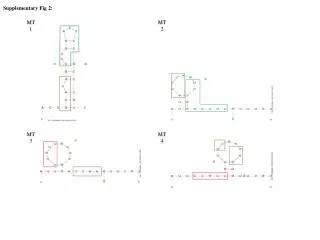
Supplementary Fig. 2. Statistical Classification Analysis Results. Box and whisker plots displaying mean performance metrics returned in the assessment of in vitro AC50 values and dosimetry-adjusted oral equivalent values in the prediction of the 28 continuous in vivo toxicity endpoints. Metrics assessed: mean absolute error and root mean squared error (RMSE) Forty SAS statistical classification models were used.* Detailed descriptions and parameters of the SAS models are provided in Supplementary Table 8; full names for the in vivo endpoints are provided in Supplementary Table 7.
In Vitro Oral Equivalent Dose – Continuous In Vivo Response Data (LEL) In Vitro Nominal AC50 and LEC Concentrations – Continuous In Vivo Response Data (LEL) Fig. 8
In Vitro Oral Equivalent Dose – Continuous In Vivo Response Data (LEL) In Vitro Nominal AC50 and LEC Concentrations – Continuous In Vivo Response Data (LEL) Fig. 8