Understanding Data Displays: Exploring Circle Graphs, Histograms, and Stem-and-Leaf Plots
In this chapter, we will delve into the world of data displays and probability. We will learn how circle graphs show parts of a whole, while histograms allow us to see distributions of data across intervals. Additionally, stem-and-leaf plots will help us visualize datasets and determine key statistics such as median, mode, and range. You'll engage in activities that involve calculating probabilities, identifying outliers, and comparing data representations. Get ready to enhance your data literacy!


Understanding Data Displays: Exploring Circle Graphs, Histograms, and Stem-and-Leaf Plots
E N D
Presentation Transcript
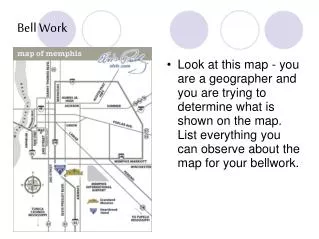
Bell Work On a piece of notebook paper… In this chapter we will be learning about data displays and probability. Write 3 complete thought sentences predicting what we will learn about in this chapter.
Circle Graphs, Histograms, and Stem-and-Leaf Plots Text book page 358
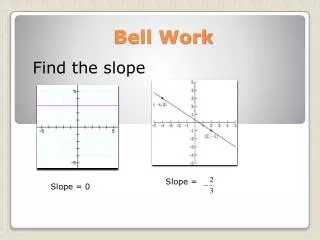
Circle Graphs Circle graphs display data as part of a whole.
Circle Graphs – You Try Nevada had only 3% 13% + 6% = 19%
Histograms – You Try b. Between 600-699 c. Between 0-99
Hey diddle, diddle the MEDIAN is the middle, You add and divide for the MEAN. The MODE is the one that appears the most, And the RANGE is the difference between.
Stem – and – Leaf Plots You Try Range: 61 – 8 = 53 Median: 35 (middle) Mode: 40 (appears the most)
Think – Pair – Share Teacher poses problems. Students will attempt to solve problems individually. They will check their answers with their shoulder partners. If partner is struggling partner will coach.
Circle Graph • 4% of 298 million = 11.92 million • 53% - 43% = 10% • 10% of 298 million = 29.8 million Americans 43%
Histogram b.) Not very likely. Only 2 out of 25 (4%) volcanoes are this height. c.) Between 18,000-20,999 feet tall. a.) Add up the number of volcanoes in the table (25) then look at how many are less than 8,999 feet tall (15). 15 is what percent of 25?
Stem-and-Leaf Plot b.) Median (middle): 11 Mode (appears the most): 11 • c.) Range: 14 – 6 = 8 Median: 11 • Mode: 11 Mean: 10.8 years a.) Oldest age – youngest age 14 – 9 = 5