Download
1 / 20
200 likes | 340 Vues
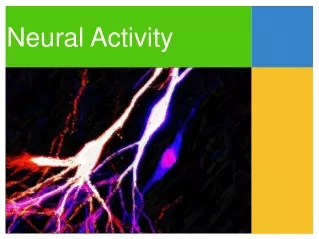
Inhibitory neural activity produces a significant BOLD response in human cortical areas. Archana Purushotham, Seong-Gi Kim Center for Magnetic Resonance Research, Depts of Radiology and Biomedical Engineering, University of Minnesota, USA. Acknowledgements:

E N D
Inhibitory neural activity produces a significant BOLD response in human cortical areas Archana Purushotham, Seong-Gi Kim Center for Magnetic Resonance Research, Depts of Radiology and Biomedical Engineering, University of Minnesota, USA Acknowledgements: Robert Jech, Tommy Vaughan, Gregor Adriany, Peter Andersen
Introduction Understanding the neural correlates of BOLD activity: Does it result from excitation alone, or from both excitation and inhibition? Arthurs and Boniface, Trends in Neurosciences 2002
Waldvogel et. al., Nature 2000 Task: simple push-button; go/no-go trials Confirmed inhibition in primary motor cortex (M1) by TMS fMRI: no significant change from baseline for M1 during no-go task; present in pre-supplementary motor area. Inhibition is metabolically much less demanding than excitation: does not give rise to an observable BOLD response in M1. Our hypothesis: Being a very simple task, the inhibitory component accompanying no-go trials is very small, insufficient to give rise to a detectable BOLD response in M1
Objective To determine the BOLD correlates of inhibitory neural activity in the human motor cortex, using a delayed, pre-cued directed go/no-go task.
Paradigm A delayed, cued joystick go/no-go task: • Variable, pseudo-randomized delay periods : 0, 2, 4 and 7 sec • No-go trials occurred 20% of the time: after 7.3 seconds, centre circle turned black instead of green • Trial epochs : 30 or 35 seconds long; 30-40 trials
Data Acquisition fMRI • Single-shot 64 x 64 EPI images using a 4 Tesla MRI system • 9 normal adult, right-handed human subjects • 5 axial sections of thickness 5 mm each, including the primary, supplementary (SMA) and pre-motor areas • TR = 1sec for most subjects; 0.5 sec for 2 subjects • Structural images 128 x 128 T1-weighted (FLASH or segmented EPI) Electromyography • Surface EMG of flexors and extensors of forearm, simultaneously for 3 subjects, pre-fMRI training for 1.
Data Analysis • EMG epochs checked for untimely activity, and behavioural data for errors; corresponding epochs excluded • Timecourses detrended linearly if drifts were apparent • fMRI epochs grouped by delay period and averaged to get mean timecourse for each delay condition • Cross-correlation based on the no-delay epoch time-course used to generate maps (3 maps based on different thresholds)
Data Analysis (contd.) • Primary and supplementary motor areas demarcated manually using structural images • Epoch time-courses created by averaging over activated voxels in each area • Compared time-courses for 7-second delay condition (go) versus no-go condition, for each area • Used data from subjects with sufficient SNR (judging from comparability of preparation activity for go and no-go tasks)
Reaction time (msec) 0 2 4 7 Delay period (sec) Does a state of preparedness to move exist?
Go trial No-go trial Time (sec) Surface electromyogram of forearm muscles
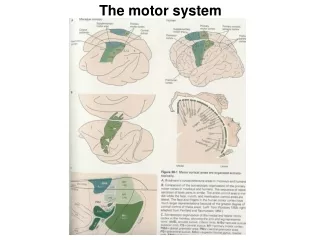
P SMA M1 L R Central sulcus A Contra. Regions of interest Activation map based on no-delay movement
BOLD % change Time (sec) SMA (n = 7; CC = 0.7) Prep. Go/ No-go
BOLD % change Time (sec) M1 (n = 7; CC = 0.7) Prep. Go/ No-go
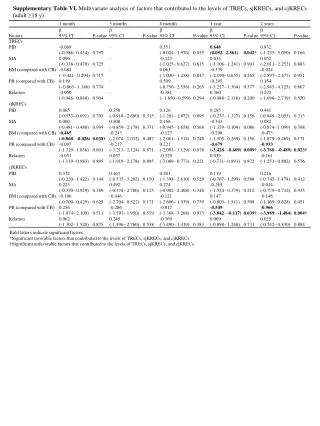
Consistency of observed result Three statistical thresholds (CC = 0.6, 0.7, 0.8) used for analysis : result independent of threshold • Across subjects: • 6 out of 7 subjects clear inhibition-related BOLD response in M1 • 1 subject amplitude change very low; not individually convincing
Go cue No-go cue Prep. cue Schematic of neural activity Higher order motor areas (including SMA) Primary motor area Muscular activity
Evoked potential recording: preliminary data A Contra. Ipsi. P
Cz (midline) go Evoked potential (V) no-go Time w.r.t appearance of go/no-go cue (100 msec)
C3 (contralateral) go Evoked potential (V) no-go Time (100 msec)
Conclusion Inhibitory synaptic activity in the primary motor area during non-performance of a prepared task is associated with a significant BOLD signal. The amplitude of the BOLD signal peak due to inhibition is comparable to that due to preparation.
C4 (ipsilateral) Evoked potential (V) Time (100 msec)