Download
1 / 14
140 likes | 161 Vues
Learn about the importance of climate quality data, current collection efforts, assessment of uncertainty, and ways VOSClim contributes to improving datasets and monitoring ships for better data consistency.

E N D
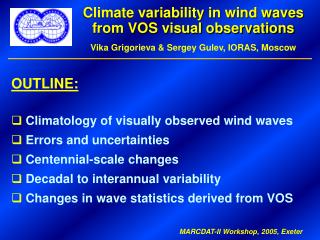
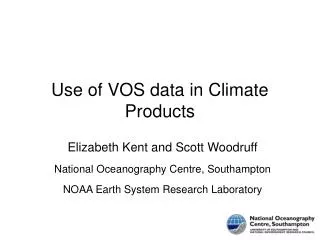
Climate quality data and datasets from VOS and VOSClim Elizabeth Kent and David Berry National Oceanography Centre, Southampton
Outline • The requirement for climate quality data • What are we collecting now? • How best to improve the datasets? • How does VOSClim help?
The requirement for climate-quality data • GCOS implementation plan • Climate datasets (e.g. Hadley Centre, NOAA) • Satellite bias adjustment • Flux datasets (includes visual observations of cloud and weather codes) • SURFA NWP flux validation project • NWP/reanalysis validation • Satellite cal/val
What are we collecting now? • Difficult to assess adequacy, need to know: • Number of observations • Distribution of sampling in space and time • Platform information and number of reports from each platform • Natural variability • Autocorrelation time and space scales • Random uncertainty in observations (intra-platform uncertainty) • Bias uncertainty between observation types (inter-platform uncertainty) • Overall bias • User requirement: target and useable accuracies, time and space scales • Only the first 2 are easy to calculate
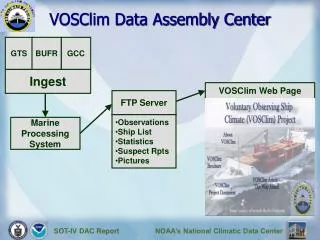
How do we assess uncertainty? • Comparisons of co-located observations • Comparison with a common standard • Approach taken with VOSClim • Common standard is Met Office NWP model output • Also have co-located data and model output for all VOS, drifters and moored buoys • Need to partition uncertainty between model and forecast (very basic approach taken so far)
What data do we need? • Lots of data in high variability regions • Smaller amounts of high quality data in lower variability regions • Sampling in space and time • Far apart to increase representivity • Co-locations to perform quality assurance • Data from lots of different platforms OR data from single platform with small bias • Identifiable platforms with metadata and quantified uncertainty • Sampling of the diurnal cycle • Either fully sampled or randomly sampled (to avoid aliasing)
Uncertainty estimates: Air Temp, Feb 07 intra-platform (random) inter-platform (bias) sampling total
What are the sources of uncertainty? • Sampling uncertainty • Need lots of data, appropriately arranged in space and time • Purely random errors • can be overcome with large data volumes • Biases between platforms • Can be overcome with data from a variety of sources • Need more research, and co-located data from different platforms • Overall bias • Hard to identify - need as many sources of data as possible
How does VOSClim help? • VOSClim ships overall are typically better than average • For each country VOSClim ships are typically better than the average for the country • Some exceptions, e.g. • UK VOSClim pressure data is worse than their VOS pressure data (but still better than the overall average)
How does VOSClim help? • VOSClim shows that operators are aware of factors that indicate which ships provide the best data. • In what way are the VOSClim data better? • Data are very much more consistent among the VOSClim ships than among the VOS generally • Improvements in random uncertainty for an individual ship are less dramatic but still important • Does the improved monitoring for VOSClim help? • Not sure how to demonstrate this - depends on response to monitoring • Do the extra parameters in delayed mode help? • Pretty sure they will (based on previous VSOP-NA), but data availability until recently was not good • Do the photos help? • Yes, we have used them to relate air temperature sensor exposure to the characteristics of the data from the sensor.
Future improvements • Data shown are as reported • Can apply height adjustments - should bring down inter-platform uncertainty • Can apply bias adjustments, e.g. for solar radiative heating of air temperature - should bring down random (intra-platform) uncertainty and also inter-platform uncertainty • Use delayed mode data and parameters • Should help to improve winds, temperature (and possibly humidity), and maybe SST • Improve partition of data and model uncertainty
Conclusions • VOSClim data are better than average • Improvements are mainly in the consistency of the data • Many "good" ships aren't in VOSClim • A few "bad" ships are • Sampling uncertainty is still a major problem in many regions - we need more data (improved data quality doesn't really help here) • All VOS should report delayed mode parameters • Now have useful information which we can feed back to ship operators (how?) • With improved data flow and volumes we are now poised to exploit the information in the VOSClim dataset