Circle Graphs and Percents
180 likes | 290 Vues
Learn how to interpret data presented in circle graphs to understand percentages. Practice solving examples and guide your understanding of how the whole circle represents 100%, and each section indicates a specific percentage allocation. Enhance your math skills with guided practice exercises.

Circle Graphs and Percents
E N D
Presentation Transcript
Circle Graphs and Percents
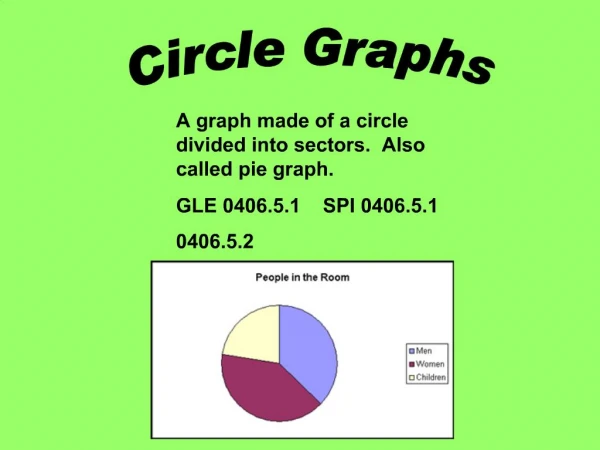
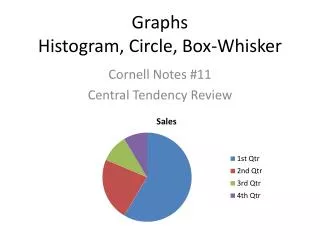
Circle Graphs and Percents You’ll have seen circle graphs before in earlier grades. They’re often used to compare different percents. Circle graphs are useful because they show clearly how the size of one group relates to another.
Circle Graphs and Percents 100% is Equal to the Whole Amount 100% of something is all of it. It’s important to remember this when you’re looking at questions about percents.
Circle Graphs and Percents Example 1 Yesenia has a number of marbles. 65% of the marbles are red. The rest are all blue. What percent of Yesenia’s marbles are blue? Solution All the marbles are either red or blue. percent of red marbles + percent of blue marbles = all marbles 65% + percent of blue marbles = 100% percent of blue marbles = 100% – 65% = 35% So 35%of Yesenia’s marbles are blue. Solution follows…
This graph represents a math class split into boys and girls. Circle Graphs and Percents Circle Graphs Are Often Divided into Percents Circle graphs show how a total splits into different parts. The whole circlerepresents the whole class. The two sectionsrepresent the boysand the girls. The girls section is larger. This means the class has more girls than boys.
100% 25% 50% 25% Circle Graphs and Percents When a circle graph shows percents, the whole circle represents 100%. A section that representsa certain percentfills that percent of the circle.
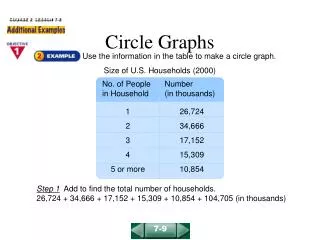
Circle Graphs and Percents Example 2 This circle graph shows the results of a survey to find which out of apples, bananas, and oranges students liked best. What percent of the students like bananas best? Solution The whole circle represents 100%, so the total value of all the sections must be 100%. Call the percent of students who like bananas best b%. Then 25 + 35 + b = 100 The total of all sections is 100% 60 + b = 100 25 + 35 = 60 b = 100 – 60 = 40 Subtract 60 from both sides So 40%of the students like bananas best. Solution follows…
Circle Graphs and Percents Guided Practice In Exercises 7–10, find the missing value in each circle graph. 7. 8. 100% – 50% = 50% 100% – (55 + 30)% = 15% 9. 10. 100% – (31 + 24)% = 45% 100% – (34 + 19 + 21)% = 26% Solution follows…
20 2 20 2 10 1 Water: , Juice: , Milk: = = = 50 5 50 5 50 5 Circle Graphs and Percents Guided Practice A survey asked people which of three drinks they prefer. This graph shows the number of people who said they prefer each drink. 11. How many people answered the survey? 20 + 20 + 10 = 50 people 12. What fraction of these people preferred each drink? 13. What percent of these people preferred each drink? Water: (1 ÷ 5) × 100 = 20%, Juice: (2 ÷ 5) × 100 = 40%, Milk: (2 ÷ 5) × 100 = 40% Solution follows…
Circle Graphs and Percents Guided Practice This graph shows the number of insects a scientist counted for a study. 14. How many insects were there in total? 125 + 75 + 125 + 175 = 500 insects 15. What percent of each type of insect were there? Crickets: (125 ÷ 500) × 100 = 25%, Wasps: (75 ÷ 500) × 100 = 15%, Bees: (125 ÷ 500) × 100 = 25%, Butterflies: (175 ÷ 500) × 100 = 35% Solution follows…
If this graph represents 200 people… 25% 50% 25% Circle Graphs and Percents You Can Turn Percents on Circle Graphs into Numbers If you know how many unitsmake up the full 100%of a circle graph, then you can work out how many each section represents. …then 100% = 200 people… …so 25% = 50 people
Circle Graphs and Percents Example 3 Chris, Martina, and D’Andre each ran for student body president. A total of 150 students voted in the election, and the outcome of the election is shown in the circle graph. How many students voted for Martina? Solution The circle graph tells you 40% of the students voted for Martina. You know that the whole circle graph represents 150 students. So the number of students who voted for Martina is 40% of 150 = 0.4 × 150 = 60 A total of 60 students voted for Martina. Solution follows…
Circle Graphs and Percents Round Up Circle graphs are useful for giving out information. People who don’t know much about math can still understand what it means when one part of the circle is bigger than another.