Download
1 / 67
670 likes | 793 Vues
Chapter 9 – Hypothesis Tests concerning One Population Mean. Hypothesis testing is basic to the scientific method and statistical theory gives us a way of conducting tests of scientific hypotheses.

E N D
Hypothesis testing is basic to the scientific method and statistical theory gives us a way of conducting tests of scientific hypotheses.
Scientific philosophy today rests on the idea of falsification: For a theory to be a valid scientific theory it must be possible, at least in principle, to make observations that would prove the theory false.
Scientific theories are usually made up of many hypotheses and the hypotheses are often tested individually, not the theory as a whole.
For example, here is a simple hypothesis:All swans are white
Hypothesis: All swans are whiteThis is a valid scientific hypothesis because there is a way to falsify it: I can observe one black swan and the hypothesis would fall.For more information on the history and philosophy of falsification read Karl Popper.
Besides the idea of falsification, we must keep in mind the other basic tenant of the scientific method:All evidence that supports or falsifies a theory or hypothesis must be empirically based and reproducible.
In other words, data! Just holding a belief (no matter how firm) that a theory or hypothesis is true or false is not a scientifically justifiable stance.
Hypothesis testing in statistics has an underlying assumption that is similar in nature to how our (U.S.) legal system is set up.In our legal system, a person is assumed innocent (hypothesis) unless the evidence (data) shows otherwise.
In hypothesis testing, the hypothesis under investigation is assumed true and then is examined in light of the data.We use statistical methods to make a decision on the validity of the hypothesis.
ExampleLets assume a hypothesis under consideration is:The mean height of males in the U.S. is 70 inches.
The mean height of males in the U.S. is 70 inchesis called the Null Hypothesis and is the hypothesis we assume true to start with but may be nullified (falsified) given empirical evidence.
The mean height of males in the U.S. is 70 inchesis called the Null Hypothesis.It is called the null hypothesis because we are collecting data to see if the data nullifies or falsifies it.
Null Hypothesis: The mean height of males in the U.S. is 70 inchesIf the data does not falsify the null hypothesis then we go on believing the null hypothesis is true.If the data does falsify the null hypothesis then we have to stop believing the truth of the null hypothesis in favor of an alternative hypothesis.
Null Hypothesis: The mean height of males in the U.S. is 70 inchesUsually alternative hypotheses are more general than the null hypothesis.
Null Hypothesis: The mean height of males in the U.S. is 70 inchesFor this example, our alternative hypothesis is: The mean height of males in the U.S. is not 70 inches.
Special notation has been developed for expressing a null and alternative hypothesis concerning a population mean and for our example it is: (null hypothesis)(alternative hypothesis)
State the null and alternative hypotheses to be tested • Decide upon a level of significance for the test • Collect data • Compute a test statistic and determine the p-value of the hypothesis test • Make a decision • Interpret the decision in terminology appropriate for the scientific field in which the test was conducted
Step 1: State the null and alternative hypotheses to be tested • The null and alternative hypotheses to be tested need to be decided upon first then the testing steps follow. Too often researchers get caught up in the “research” and do not take the time to clearly articulate what it is that they want to test.
Step 2: Decide upon a level of significance for the test • A significance level is a way for an experimenter to decide upon the level of evidence necessary to reject the validity of the null hypothesis.
Step 2: Decide upon a level of significance for the test • In a court of law, this concept is captured verbally as “beyond a reasonable doubt.” May doubt still exist? Yes, but the threshold is beyond what is considered reasonable or probable.
Step 2: Decide upon a level of significance for the test • Significance in statistical hypothesis testing is expressed as an alpha (Greek letter α) level. An alpha level of α = 0.05 is typical in most sciences although an alpha level of α = 0.10 is commonly used in sciences with studies where the data often has large (and unexplained) variability such as in sociological and psychological studies. How to use the significance level will be discussed in Step 5.
Step 3: Collect data • This could be the basis for a course in itself. A study, experiment, survey, etc… is conducted and data is gathered. The quality of data and subsequent reliability of the hypothesis test depends on the quality of the way the data was generated!
Step 4: Compute a test statistic and determine the p-value of the hypothesis test • There are particular formulae for different types of hypotheses tests and once the experimenter determines the type of test they are conducting they can choose the appropriate formula.
Step 4: Compute a test statistic and determine the p-value of the hypothesis test • The formulaic computations result in a value called the test statistic. This value captures the information necessary to make a decision.
Step 4: Compute a test statistic and determine the p-value of the hypothesis test • Once the test statistic has been computed, the p-value of the hypothesis test can be obtained from the test statistic. • I recommend you use technology to compute test statistics. While you can compute test statistics by hand, it is cumbersome and it is possible to make errors.
Step 5: Make a decision • There are only two decisions an experimenter can make based on the hypothesis test theory presented in this course. • Fail to reject the validity of the null hypothesis. • Reject the validity of the null hypothesis in favor of the alternative hypothesis.
Step 5: Make a decision • The criterion for making a decision is easy, based on the p-value, and always the same: • If p-value > α then: Fail to reject the validity of the null hypothesis. • If p-value ≤ α then: Reject the validity of the null hypothesis in favor of the alternative hypothesis.
Step 6: Interpret the decision in terminology appropriate for the scientific field in which the test was conducted • In the classroom, this step is often forgotten or poorly done, but is very critical!
Step 6: Interpret the decision in terminology appropriate for the scientific field in which the test was conducted • The experimenter must always remember that they have specialized training and understanding of the research problem and they must describe the results of an hypothesis test in terms that the audience of the results can understand.
Step 6: Interpret the decision in terminology appropriate for the scientific field in which the test was conducted • The way the experimenter describes the results depends on the audience which may range in scientific sophistication from lay person to scientific colleague.
Step 6: Interpret the decision in terminology appropriate for the scientific field in which the test was conducted • The experimenter must always keep the audience in mind when explaining the results and the burden of understanding lies with the experimenter.
Example • Step 1: State the null and alternative hypotheses to be tested • (null hypothesis) (alternative hypothesis)Null Hypothesis: The mean height of males in the U.S. is 70 inchesAlternative hypothesis is: The mean height of males in the U.S. is not 70 inches.
Example • Without formally going through each step, what if a simple random sample of heights of 6 males is collected and the data are: 62, 63, 62, 60, 61, 64 • Which hypothesis is supported by this sample of data? • (null hypothesis) (alternative hypothesis)
Example • What if a simple random sample of heights of 6 males is collected and the data are: 69, 70, 71, 70, 69, 69 • Which hypothesis is supported by this sample of data? • (null hypothesis) (alternative hypothesis)
Example • What if a simple random sample of heights of 6 males is collected and the data are: 70, 71, 70, 72, 71, 71 • Which hypothesis is supported by this sample of data? • (null hypothesis) (alternative hypothesis)
Lets formally go through the steps • Step 1: State the null and alternative hypotheses to be tested
Step 2: Decide upon a level of significance for the test • The most commonly chosen value is or a 5% significance level. • The most common confidence level for a confidence interval is 95% • Coincidence?! I think not.
Step 3: Collect data • The basic type of sample needed is a simple random sample. Lets pretend we took a simple random sample of size n = 6 males in the U.S. -> 70, 71, 70, 72, 71, 71.
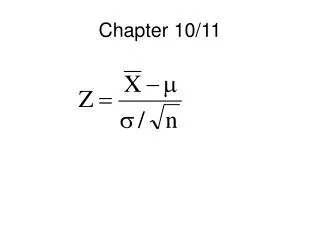
Step 4: Compute a test statistic and determine the p-value of the hypothesis test • The formula for the test statistic for a one-sample t test for one population mean is:
Step 4: Compute a test statistic and determine the p-value of the hypothesis test
Step 5: Make a decision • If p-value > α then: Fail to reject the validity of the null hypothesis. • If p-value ≤ α then: Reject the validity of the null hypothesis in favor of the alternative hypothesis. • For our example, p-value = 0.0422 and
Step 5: decision is “Reject the validity of the null hypothesis in favor of the alternative hypothesis”
Step 6: Interpret the decision in terminology appropriate for the scientific field in which the test was conducted • Reject the validity of the null hypothesis in favor of the alternative hypothesis • (null hypothesis) (alternative hypothesis)
Step 6: Reject the validity of the null hypothesis in favor of the alternative hypothesis • (null hypothesis) (alternative hypothesis) • Based on the sample of data there is statistical evidence that the mean height of all men in the U.S. is not 70 inches. In fact, the data suggest the mean height is greater than 70 inches.
Deciding upon a null and alternative hypothesis The null hypothesis is usually the “neutral” or equality situation. The alternative hypothesis is usually the hypothesis of scientific interest.
Deciding upon a null and alternative hypothesis A hypothesis test is to be performed to decide whether adult females under the age of 51 are, on average, getting less than the RDA of 18 mg of iron. What is the null hypothesis is?