Download

1 / 16
160 likes | 265 Vues
Learn about t-distribution, how to calculate probabilities using Excel functions, and interpret results for one-tail and two-tail tests. Understand the relation between t-distribution and normal distribution.

E N D
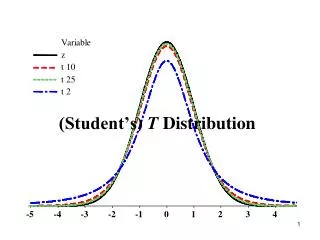
REVIEW t-Distribution
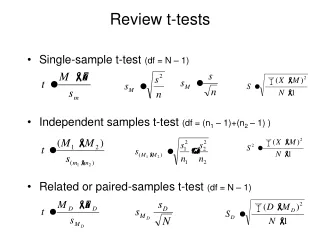
REVIEW • If tails = 1, TDIST (a,df,1) is calculated to determine P(t>a). • Excel does not work on negative a. • If tails = 2, TDIST (a,df,2) is calculated to determine P(|t| > a) = P(t > a or t < -a). • If test is two-tail, TINV(,df) returns that value a, such that P(|t| > a) = P(t < -a or t > a) = . • If test is one-tail, TINV(2*,df) returns that value a, such that P(t > a).
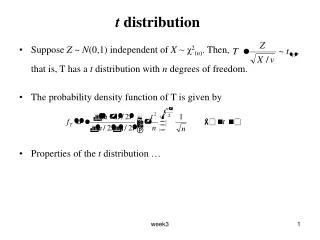
t-Distribution The student t distribution was first derived by William S. Gosset in 1908. • t is used to represent random variable. • t-distribution is very commonly used in statistical inference. • Like normal distribution, t-distribution is symmetrical about 0. • For larger degree of freedom, the t-distribution approaches standard normal distribution.
EXCEL FUNCTION for t-Distribution Given t, to find cumulative probability TDIST(t, df, tails) t: Random variable, t can not be negative df: degree of freedoms Tails: 1 for one tail, 2 for two tails TDIST returns the probability for random variable >t Example: TDIST(1.5,50,1) = 0.07
EXCEL FUNCTION for t-Distribution Given cumulative probability, to find random variable t for two-tail test TINV(p, df) p: probability df: degree of freedoms TINV is the reverse of TDIST. TINV returns the t-value of the t-distribution as a function of the probability and the degrees of freedom. Example: TINV(0.05, 30) = 2.0423
Right Tail Probability One Tail Probabilities from a to P(t>a) a
RIGHT TAIL PROBABILITIESOne Tail P(t>a) = area between a and ∞ • Probability to the RIGHT of a EXCEL: =TDIST(a,df,1) P(t100>0.56) = TDIST(0.56,100,1) = 0.2884
RIGHT TAIL PROBABILITIESOne Tail negative value P(t>a) P(t<a) a
RIGHT TAIL PROBABILITIESOne Tail negative value • Excel does not work for negative vales of t. • But the t-distribution is symmetric. Thus, • TDIST(-a,df,1) gives the area to the left of a negative value of a. • 1-TDIST(-a,f,1) gives the area to the right of a negative value of a. P(t100>-0.56) = 1-TDIST(0.56,100,1) = 0.7116
Left Tail Probability One Tail Probabilities from - to a P(t>a) P(t<a) a
LEFT TAIL PROBABILITIESOne Tail P(t>a) = area between -∞ and a • Probability to the LEFT of a EXCEL: =1-TDIST(t,df,1) P(t100<0.56) = 1-TDIST(0.56,100,1) = 1-0.2884 = 0.7116
PROBABILITIESTwo Tails EXCEL: =TDIST(a,df,2)
PROBABILITIESTwo Tails • TDIST(a,df,2) gives twice the area to the right of a positive value of t. P(t>|a|) = P(t<-a) + P(t>a) = area between –a and -∞ and area between a and ∞ EXCEL: =TDIST(a,df,2) P(t100>0.56) = TDIST(0.56,100,2) = 0.5767
Given Two-Tail Probability to find t value • TINV(p,df) returns the value a, such that P(|t| > a) = probability or P(t < -a or t > a) = probability EXCEL: =TINV(P,df) t0.05,100 = TINV(0.05,100) = 1.984
Given One-Tail Probability to find t value • If one-tail probability is given, to find the t value, you need to multiply the probability by 2 EXCEL: =TINV(2*P,df) t0.05,100 = TINV(2*0.05,100) = 1.66