Review t-tests
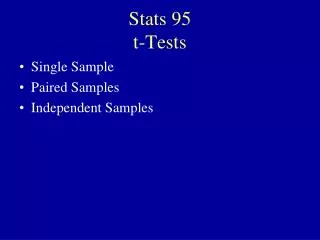
Review t-tests. Single-sample t-test (df = N – 1) Independent samples t-test (df = (n 1 – 1)+(n 2 – 1) ) Related or paired-samples t-test (df = N – 1). ANOVA formulas. One-way ANOVA df total = N – 1 df between = k – 1 df within = (n – 1) or N – k. Repeated-measures ANOVA

Review t-tests
E N D
Presentation Transcript
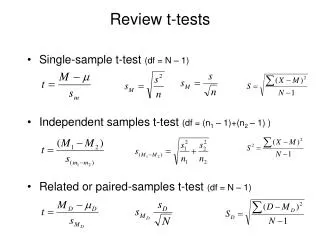
Review t-tests • Single-sample t-test (df = N – 1) • Independent samples t-test (df = (n1 – 1)+(n2 – 1) ) • Related or paired-samples t-test (df = N – 1)
ANOVA formulas One-way ANOVA dftotal = N – 1 dfbetween = k – 1 dfwithin = (n – 1) or N – k Repeated-measures ANOVA dftotal = N – 1 dfbetween = k – 1 dfwithin = N – k dfbetween subjects = n – 1 dferror = dfwithin – dfbetween subjects One-way ANOVA Repeated-measures ANOVA Two-way ANOVA dftotal = N – 1 dfbetween = k – 1 (or # cells -1) dfwithin = N – k (or (n-1) ) dfA = k – 1 (# rows – 1 for factor A) dfB = k – 1 (# columns – 1 for factor B) dfAxB = dfbetween – dfA - dfB
Effect size analyses • Variance accounted for (r2) • Small >.01 • Medium >.09 • Large > .25 • Paired samples t-test • CI = MD ± t*(sMD) • Cohen’s d • Variance accounted for (r2) • ANOVA: effect size = eta2 • z-test • CI = M +/- z*(σM) • One-sample t-test • CI = M +/- t*(sM) • Independent t-test • CI = M1 – M2 +/- t*(sM1-M2) • Cohen’s d • Small >.2 • Medium >.5 • Large > .8
Other formulas • Goodness of fit chi-square • Frequency table of data • Observed frequencies (fo) • Compare to null hypothesis • Expected frequencies (fe) • Expected frequency • fe = pn • Chi-square equation • df = C – 1, where C = # of categories