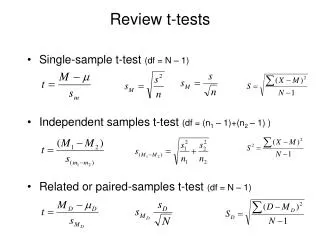
dependent t-tests
dependent t-tests. Factors affecting statistical power in the t-test. Statistical power ability to identify a statistically significant difference when a difference between means actually exists. Decision Table: Correct. DECISION. R E A L I T Y.


dependent t-tests
E N D
Presentation Transcript
Factors affecting statistical power in the t-test • Statistical power • ability to identify a statistically significant difference when a difference between means actually exists
Decision Table: Correct DECISION R E A L I T Y Truth is everlasting, but our ideas about truth are interchangeable
Factors affecting statistical power in the t-test • level • how much risk are YOU willing to take in making a Type I error • Frank & Huck (1986, RQES): Why does everyone use the 0.05 level of significance? Power 0.01 conservative 0.10 liberal
Factors affecting statistical power in the t-test • level • df (number of subjects) • affects variability associated with the sample mean & variability within the sample • limited by time & money • GREATER n = GREATER POWER (point of diminishing return)
Statistics Humour One day there was a fire in a wastebasket in the Dean's office and in rushed a physicist, a chemist, and a statistician. The physicist immediately starts to work on how much energy would have to be removed from the fire to stop the combustion. The chemist works on which reagent would have to be added to the fire to prevent oxidation. While they are doing this, the statistician is setting fires to all the other wastebaskets in the office. "What are you doing?" they demanded. "Well to solve the problem, obviously you need a large sample size" the statistician replies.
Factors affecting statistical power in the t-test • level • df (number of subjects) • magnitude of the mean difference • how different are the treatments imposed • measurement errors • sampling errors • SIZE OF THE TREATMENT EFFECT
Factors affecting statistical power in the t-test • level • df (number of subjects) • magnitude of the mean difference • variability • how specified is your population • control of extraneous variables
Estimated Standard Error of the Difference between 2 independent means
t-test for independent samples Smaller is better
Comparing paired (correlated) measures instead of group (uncorrelated) measures • Match subjects • what factors (variables) might affect time to exhaustion on the exercise bike • daily diet? Fitness level? Genetics? • Height? Weight? Age? • Regular training program?
Comparing paired (correlated) measures instead of group (uncorrelated) measures • Match subjects • Repeated measures • measure the SAME subject under both protocols • test & retest • pre & posttest • condition 1 & condition 2
Comparing paired (correlated) measures instead of group (uncorrelated) measures • Match subjects • Repeated measures Subject serves as own Control
Comparing paired (correlated) measures instead of group (uncorrelated) measures • Match subjects • Repeated measures Subject serves as own Control Intra-subject variability should be LESS than Inter-subject variability
Dependent t-test(paired or correlated t-test) • Pairs of scores are matched • same subject in 2 conditions or matched subjects • Question: Does ankle bracing affect load during landing? • IV: brace condition • DV: Vertical GRF
Steps to dependent t-test • Set (0.05) • Set sample size • One randomly selected group • n = 7 • condition 1: Brace • condition 2: No brace • Set Ho (null hypothesis)
Ho Null hypothesis Any observed difference between the two conditions will be attributable to random sampling error. HA Alternative hypothesis If Ho is rejected, the difference is not attributable to random sampling error perhaps brace??? Set statistical hypotheses
Steps to independent t-test • Set (0.05) • Set sample size (n = 7) • Set Ho • Test each subject in both conditions with a standardized protocol (drop landings) • Note: condition performance order is randomized across subjects
Steps to dependent t-test • Set (0.05) • Set sample size (n = 7) • Set Ho • Test each subject in both conditions • Calculate descriptive statistics of each condition • scattergram • mean, SD, n
Figure 1. Scattergram of vertical GRF during landing in different brace conditions (N/kg)
Steps to dependent t-test • Set (0.05) • Set sample size (n = 7) • Set Ho • Test each subject in both conditions • Calculate descriptive statistics of each condition • compare the condition means
How to compare the condition means • Even if the two conditions were the same (samples drawn from the same population), would not expect the statistics to be the same • Need a measure of expected variability against which the mean of the difference between paired scores (Xi - Yi) could be compared
Paired scores, so the data are somewhat correlated • Calculate the difference between the two conditions for each case (Xi - Yi) • Calculate the Mean Difference • Use the correlation among the pairs of scores to reduce the error term (denominator) used to evaluate the difference between the means
t-test for dependent (paired) samples Mdiff t = SEMD
GRF data = -20 Mean Diff = -2.9
t-test for dependent (paired) samples Mdiff t = SEMD Standard error of the Mean difference for Paired Scores
Estimated Standard Error of the Difference between 2 dependent means ?
Estimated Standard Error of the Difference between 2 dependent means If r= 0, this term reduces to the same equation as for independent groups
t-test for dependent (paired) samples Mdiff t = SEMD df = ??
t-test for dependent (paired) samples Mdiff t = SEMD df = npairs - 1
Running the dependent t-test with SPSS • Enter the data as pairs • atble401.sav
Reporting paired t-test outcome Table 1. Descriptive statistics of vertical ground reaction force (in N/kg) for the two conditions (n = 7)
Reporting t-test outcome * Figure 1. Mean vertical GRF in the two conditions (* p 0.05)
Reporting t-test in text Descriptive statistics of the vertical ground reaction force (VGRF) data during landing in the two braced conditions are presented in Table 1 and graphically in Figure 1. A paired t-test indicated that the mean VGRF of 10.9 (SD = 3.5) N/kg in the braced condition was significantly higher ( = 0.05) than the mean VGRF of 8.0 (4.3) N/kg in the unbraced condition (t6 = 3.57, p = 0.012). The mean difference of 2.9 N/kg represents a 36% higher VGRF during the landings with a brace compared to without a brace.
What if you set = 0.01? Descriptive statistics of the vertical ground reaction force (VGRF) data during landing in the two braced conditions are presented in Table 1 and graphically in Figure 1. A paired t-test indicated that the mean VGRF of 10.9 (SD = 3.5) N/kg in the braced condition was ...
What if you set = 0.01? Descriptive statistics of the vertical ground reaction force (VGRF) data during landing in the two braced conditions are presented in Table 1 and graphically in Figure 1. A paired t-test indicated that the mean VGRF of 10.9 (SD = 3.5) N/kg in the braced condition was significantly higher ( = 0.01) than the mean VGRF of 8.0 (4.3) N/kg in the unbraced condition (t6 = 3.57, p = 0.012). The mean difference of 2.9 N/kg represents a 36% higher VGRF during the landings with a brace compared to without a brace. not
Statistics Humour A student set forth on a quest To learn which of the world’s beers was best But his wallet was dried out At the first pub he tried out With two samples he flunked the means test Gehlbach, SH (2002) Interpreting the medical literature
Mean Difference t = Standard Error Summary: both t-tests are of the form:
Mean Difference t = Standard Error To increase statistical power Maximize Minimize
Independent no correlation between the two groups Dependent two sets of data (pair of scores) from matched subjects or from the same subject (repeated measures) data are correlated Choosing which t-test to use