Understanding T-Tests: Comparison of One-Sample and Two-Sample Approaches
This overview focuses on T-tests, emphasizing one-sample and two-sample tests. It covers independent and paired samples, explaining null hypotheses, means differences, and the importance of sample variances. Real-world examples, such as comparing the effectiveness of a new drug versus a placebo, illustrate the practical application of T-tests. The content highlights common assumptions and issues, including homoscedasticity and the effect of unequal sample sizes, while introducing alternatives like Welch’s t-test. This comprehensive guide is essential for understanding statistical testing in research.

Understanding T-Tests: Comparison of One-Sample and Two-Sample Approaches
E N D
Presentation Transcript
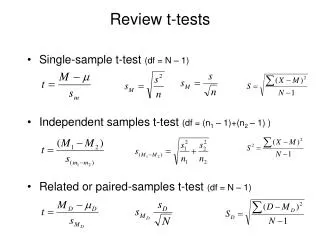
Outline • Review the One-sample case • Independent samples • Basics • Unequal N • Example • Issues • Paired samples • Basics • Examples • Comparing formulas • Conclusion
Two samples • Previously compared sample mean to a known population mean • Now want to compare two samples • Null hypothesis: the mean of the population of scores from which one set of data is drawn is equal to the mean of the population of the second data set • H0: m1=m2 or m1 - m2 = 0
Independent samples • Consider the original case • Now want to consider not just 1 mean but the difference between 2 means • The ‘nil’ hypothesis, as before, states there will be no difference • H0: m1 - m2 = 0
Which leads to... • Now statistic of interest is not a single mean, but the difference between means: • Mean of the ‘sampling distribution of the differences between means’ is:
Variability • Standard error of the difference between means • Since there are two independent variables, variance of the difference between means equals sum of their variances
Same problem, same solution • Usually we do not know population variance (standard deviation) • Again use sample to estimate it • Result is distributed as t (rather than z)
Formula • All of which leads to:
But... • If we are dealing with a ‘nil’ null hypothesis: • So the formula reduces to: • Across the 2 samples we have (n1-1) and (n2-1) degrees of freedom1 df = (n1-1) + (n2-1) = n1 + n2 - 2
Unequal sample sizes • Assumption: independent samples t test requires samples come from populations with equal variances • Two estimates of variance (one from each sample) • Generate an overall estimate that reflects the fact that bigger samples offer better estimates • Oftentimes the sample sizes will be unequal
Weighted average Which gives us: Final result is:
Example New drug MemoPlus is supposed to aid memory. 5 people take the drug and we compare them to a control group of 10 people who take a placebo. Look at their free recall of 10 items on a word list. Control: mean = 4.5, SD = 2.0 Drug: mean = 6.0, SD = 3.0
Start with variance Using Get: [note pooled variance nearer to group’s with larger n]
Calculate t • Enter the values: • Critical value approach • t.05(13) = 2.16 • Specific p • p = .17
Conclusion? • Our result does not give us a strong case for rejecting the null. MemoPlus, like Ginko Biloba1, does nothing special for memory.
More issues with the t-test • In the two-sample case we have an additional assumption (along with normal distribution of sample scores and independent observations) • We assume that there are equal variances in the groups • Recall our homoscedasticity discussion, it is the exact same assumption1 • Often this assumption is untenable, and the results, like other violations result in using calculated probabilities that are inaccurate • Can use a correction, e.g. Welch’s t
More issues with the t-test • It is one thing to say that they are unequal, but what might that mean? • Consider a control and treatment group, treatment group variance is significantly greater • While we can do a correction, the unequal variances may suggest that those in the treatment group vary widely in how they respond to the treatment (e.g. half benefit, ¼ unchanged, ¼ got worse) • Another reason for heterogeneity of variance may be related to an unreliable measure being used • No version of the t-test takes either into consideration • Other techniques, assuming enough information has been gathered, may be more appropriate (e.g. a hierarchical approach), and more reliable measures may be attainable
Paired sample t-test Comparing two distributions that are likely to be correlated in some way Gist: some sort of meaningful relationship between our two samples. When are two distributions likely to be correlated? Natural Pairs: Comparing the scores of two subjects who are related naturally E.g. twins. Matched Pairs: Pairs two subjects on some characteristic that is likely to be important to the variable that you are studying. Members of the pair are randomly assigned to the two conditions. E.g. married couples Repeated Measures: Same person at two different times. T-test for dependent samples
Difference scores • While we technically have two samples of data, the test regards the single sample of difference scores from one pair to another • Transform the paired scores into a single set of scores • Find the difference for each case • Now are we have a single set of scores and a known population mean, a familiar situation • Use the one sample t test concept • If the null hypothesis is true then on average there should be no difference • Thus mean difference is 0 ( mD = 0 )
Paired t test Where = Mean of the difference scores sD = Standard deviation of the difference scores n = Number of difference scores (# pairs) df = n-1
Example • We want to know if dog owners affection for their dog changes after they take a course in dog psychology • We measure their responses on the the Dog Affection Inventory both before and after the course
Data • t(9)= 3.71, p = .005 2 • Conclusion ?
The good and the bad regarding t-tests • The good • If assumptions are met, t-test is fine • When assumptions aren’t met, t-test may still be robust with regard to type I error in some situations • With equal n and normal populations HoV violations won’t increase type I much • With non-normal distributions with equal variances, type I error rate is maintained also • The bad • Even small departures from the assumptions result in power taking a noticeable hit (type II error is not maintained) • t-statistic, CIs will be biased