Download
1 / 25
250 likes | 345 Vues
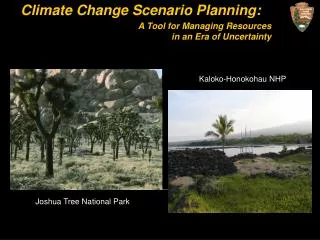
Explore surge inundation and depth models, basin water rise, and sea level rise tools used in evacuation planning and climate change modeling. Learn about SLOSH basin toolset and 3D visualization software for accurate visualization of storm impacts.

E N D
GIS Tools used in Evacuation Planning and Climate Change Modeling Marshall Flynn IT/GIS Director Tampa Bay Regional Planning Council Pinellas Park, FL
Surge Inundation Model (Maximum Storm Tide Extent) Surge Depth Model (Storm Tide Depth Over Land) Basin Bathtub Water Rise Model Approximate Surge and Sea Rise Model 3D Visualization Software Types of Tools in the Toolshed:
LIDAR to SLOSH Basin to Surge Zones Surge Inundation Model
What is SLOSH? • Sea, Lake, and Overland Surge from Hurricanes • A computerized model developed by the National Hurricane Center (NOAA) to estimate storm surge heights from winds resulting from historical, hypothetical, or predicted hurricanes.
What are we trying to do anyway? Water does not behave like what is depicted in SLOSH grids at the human scale. The Surge Model is meant to alleviate the jagged puzzle…. Average Surge Height Average Surge Height Average Surge Height Average Surge Height SLOSH grids actually much bigger
An area with SLOSH MOMs in their default square basin form. Circled area would be devoid of surge if not interpolated.
You can see how the interpolation hugs the terrain as in real life. That is what you are looking for.
Shows the relief detail of Digital Elevation, if shaded and shadowed…
Surge Zones Are Used For Evacuation Zone Choices How a County May Delineate the Evacuation Zones
Surge Depth Model • Based on Inundation Model • Derives Depth Ranges for each Category Storm • Uses Maximum of Maximums SLOSH Basin • Fine-Grained Decision-Making per Storm Category • Also Displayed in Atlas Format in State Study
Basin Bathtub Water Rise Model • Simplified Non-SLOSH Water Rise • Created for Need Request by MacDill AFB • Allows Water Rise Depths with No Wind Influence
Estimated Surge and Sea Level Rise Model • Approximates Storm Tide with Base Sea Level Changes • Best Method using SLOSH without NHC Re-Running • Based on Previous Surge Model Tools
30 Inch SLR Base with Repeat 1921 Storm White Outline is Current Sea Level Shoreline
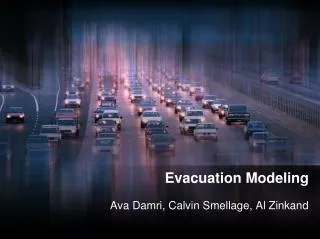
3D Visualization • Allows Some Perspective Views of 2D GIS Inundation Scenarios • Some Applications Have Hydrodynamics Built-in • What-if Impacts Can Have Real World Feel
Thanks, and Have a Great Day! TBRPC GIS Tampa Bay, 2014 Florida