Analysis of Immune Cell Responses: CD4 and CD8 Dynamics Over Multiple Days
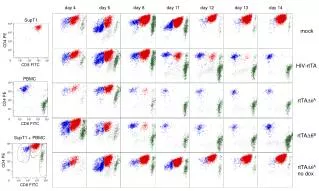
This study investigates the behavior of immune cell populations, specifically CD4 and CD8 T cells, across designated time points: days 4, 6, 8, 11, 12, 13, and 14. Using flow cytometry, we assess the expression of distinct markers on SupT1 cells and PBMCs after exposure to different treatments, including HIV-rtTA systems. The research aims to elucidate the effects of these treatments and the corresponding immune responses over time, shedding light on potential therapeutic avenues for HIV management.

Analysis of Immune Cell Responses: CD4 and CD8 Dynamics Over Multiple Days
E N D
Presentation Transcript
day 4 day 6 day 8 day 11 day 12 day 13 day 14 104 SupT1 + PBMC 103 mock CD4 PE 102 101 0 101 102 103 104 CD8 FITC HIV-rtTA SupT1 rtTAD6A 104 103 CD4 PE 102 rtTAD6B 101 0 101 102 103 104 CD8 FITC 104 rtTAD6A no dox 103 PBMC CD4 PE 102 101 0 101 102 103 104 CD8 FITC