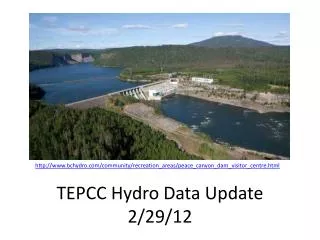
Hydro Data Update
Hydro Data Update. Hydro Data sets. 2022 – Complete 2011/High hydro case used some scaled monthly generation values due to incomplete EIA data 2010 Model Case – Complete, initial runs and validating in progress

Hydro Data Update
E N D
Presentation Transcript
Hydro Data sets • 2022 – Complete • 2011/High hydro case used some scaled monthly generation values due to incomplete EIA data • 2010 Model Case – Complete, initial runs and validating in progress • 2010 HD Comparison Case – Initial data sets complete, may revise based on lack of confidence in RC data for some plants
2011 Monthly Net scaling • Missing monthly energies for many plants • Calculated scaling factors for each plant based on the 2011 EIA data that was available (large plants) and 2005 EIA data for the same plants • Calculated scaling factors based on 2011 and 2005 unregulated flows for large rivers in each region for comparison
Summary • Makes sense to use the generation scaling factors • Average regional scaling factor • Heavily favors large plants in NW and East, since that was the EIA data available • East 2001 Anomaly?
2010 Model Case Results • NW - HTC Validation satisfactory • Monthly energies agree with input energy • Differ from PLF • Have higher standard deviation than PLF • Compare well with historical shapes - from a source mix of COE and RC
2010 Model Case Results • CA - HTC Validation satisfactory • Monthly energies agree with input energy • Differ from PLF • Have higher standard deviation than PLF • Large plants compare well with historical shapes, smaller plants don’t - from a source of mostly RC with some PAC and aggregate-derived shapes • Need to revise some plants ‘ flexibility
2010 Model Case Results • East - HTC Validation satisfactory • Monthly energies agree with input energy • Differ from PLF • Have higher standard deviation than PLF • Compare well with historical shapes - from source WAPA
Items for Thought • Make flexibility adjustments? • EIA data unreliable? • More sources for monthly energy data? • CEC, etc. • Metrics for comparing 2010 model case to 2010 datacentric case