Organizing HYSYS Variables for Equilibrium Constant and Composition Management
This guide outlines the step-by-step process to set conditions in HYSYS for stream compositions under specified temperature and pressure. It details how to compute the exit compositions and includes instructions for adding components like i-butane and n-butane. Additionally, it explains how to extract the equilibrium constant from reactor properties and transfer it to a spreadsheet for better organization and access. The procedure helps in efficiently managing variables within HYSYS, enhancing data analysis and interpretation.

Organizing HYSYS Variables for Equilibrium Constant and Composition Management
E N D
Presentation Transcript
Second First
second first
first second
2 3 1
Set conditions on in/out streams: T, P, flow in (use some basis like 1 kgmole/hr), composition in. Set T and P out. Hysys will compute the compositions for V-Out.
Also add “Master Comp Mole Frac”, then choose both components: i-butane/add; then n-butane/add. Close the window.
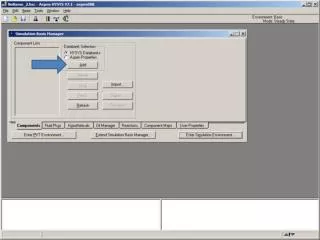
We would also like to add the equilibrium constant which is reported in the reactor properties, but it turns out that this variable is not accessible directly from the DataBook variables list. So, here’s what we have to do: 1) create a spreadsheet on the PFD, 2) open the spreadsheet and the reactor properties at the same time, 3) drag the equilibrium constant into the spreadsheet, and 4) return to the DataBook and add the variable we added to the spreadsheet. The next slides shows how to do this.
Open the reactor properties and navigate to the Reactions/Results page. You want to add the value of the equilibrium constant (1.0711 in this case) to the spreadsheet.
Get the spreadsheet and reactor properties pages both visible at the same time. Right click on the equilibrium constant value and hold the right button down. Now drag over to the spreadsheet and drop it in a convenient spot such as cell A1. This is a valuable method in HYSYS to organize and access variables in spreadsheets.
Should look like this. Now, close both windows and go back and open the DataBook.
The spreadsheet now appears in the list of objects, so highlight that and choose the cell you want: A1
You should now have something like this. Next, choose the “Case Studies” tab
First Last
Last Next to Last
Try this And this
The transposed table is especially useful. Click/Drag to highlight/Copy just like Excel, then you can paste to Excel. Remember that the column labeled “A1” is the cell A1 in the spreadsheet and is the equilibrium constant.