HIV Epidemic Update and Prevention Strategies in Sub-Saharan Africa
This comprehensive report analyzes HIV prevalence, prevention measures, and projected impact in sub-Saharan Africa from 2001 to 2020. Data includes new infections, deaths, prevalence among different age and gender groups, and effective prevention strategies.

HIV Epidemic Update and Prevention Strategies in Sub-Saharan Africa
E N D
Presentation Transcript
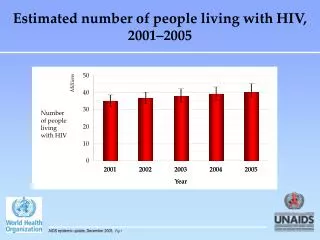
Estimated number of people living with HIV, 2001–2005 50 Millions 40 30 Number of people living with HIV 20 10 0 2001 2001 2002 2002 2003 2003 2004 2004 2005 2005 Year Year AIDS epidemic update, December 2005. Fig 1
Projected new adult infections and total adult deaths in sub-Saharan Africa, in millions, by the year 2020: Impact of three scenarios compared to baseline New HIV infections AIDS deaths 5.0 3.0 Millions Millions 2.5 4.0 2.0 3.0 1.5 2.0 1.0 1.0 0.5 0.0 0.0 2003 2005 2007 2009 2011 2013 2015 2017 2019 2003 2005 2007 2009 2011 2013 2015 2017 2019 Year Year Baseline Treatment-centered Prevention-centered Comprehensive response Source: Salomon JA. et al, Integrating HIV Prevention and Treatment: From Slogans to Impact. PLoS Medicine. January 2005, Vol 2, Issue 1. AIDS epidemic update, December 2005. Fig 2
HIV prevalence among 15–24 year-old men and women, selected countries in sub-Saharan Africa, 2001–2005 20 Women Men 15 % HIV prevalence 10 5 0 Mali 2001 Ghana 2003 Kenya 2003 Zambia 2002 Lesotho 2004 Tanzania 2003 Cameroon 2004 Uganda 2004/05 South Africa 2002 Burkina Faso 2003 Zimbabwe 2001/02 Sources: Demographic and Health Surveys. ORC Macro (Ghana, Burkina Faso, Mali, United Republic of Tanzania, Cameroon, Lesotho, Kenya, Zambia); Department of Health, Uganda HIV/AIDS sero-behavioural survey 2004/2005 (Uganda); Ministry of Health and Child Welfare, Zimbabwe National Family Planning Council, National AIDS Council , and CDC, The Zimbabwe Young Adult Survey 2001-2002 (Zimbabwe); Pettifor AE, et al. HIV and sexual behaviour among young South African: a national survey of 15-24 year olds (South Africa). AIDS epidemic update, December 2005. Fig 3
Percentage of young people aged 15–24 years who correctly identified major ways of preventing the sexual transmission of HIV*, 2003 60 Female Male 50 40 30 % 20 10 0 Burkina Faso Cameroon Ghana Kenya Madagascar Mozambique Nigeria UR Tanzania *Using condoms and limiting sex to one faithful, uninfected partner, who reject the two most common local misconceptions about HIV transmission, and who know that a healthy looking person can transmit HIV. Source: Demographic and Health Surveys. ORC Macro (Burkina Faso, Cameroon, Ghana, Kenya, Madagascar, Mozambique and Nigeria); Tanzania HIV/AIDS Indicator Survey 2003-04, TACAIDS, NBS, and ORC Macro (UR Tanzania). AIDS epidemic update, December 2005. Fig 4
HIV prevalence in pregnant women attending antenatal clinics in sub-Saharan Africa, 1997/98–2004 Southern Africa Eastern Africa Botswana Zimbabwe UR Tanzania South Africa* Ethiopia Mozambique Kenya Uganda *data by province West Africa Cote d'Ivoire Nigeria Ghana Senegal Sources: Ministry of Health (Mozambique); Department of Health (South Africa); Ministry of Health and Child Welfare (Zimbabwe); Ministry of Health (Kenya); Ministry of Health (United Republic of Tanzania); Ghana Health Service (Ghana); Centers for Disease Control and Prevention (CDC) - GAP - Côte d'Ivoire (Côte d'Ivoire); Conseil National de Lutte Contre le SIDA (Senegal); Adapted from Asamoah-Odei, et al. HIV prevalence and trends in sub-Saharan Africa: no decline and large subregional differences. Lancet, 2004 (Botswana, Ethiopia, Uganda and Nigeria). AIDS epidemic update, December 2005. Fig 5
HIV prevalence among pregnant women attending antenatal clinics in South Africa and Zimbabwe, by age group, 2000–2004 South Africa 50 Age group 40 <20 30 20 - 24 % HIV prevalence 25 - 29 20 30 - 34 10 35 - 39 40+ 0 2000 2001 2002 2003 2004 Zimbabwe 50 Age group 40 15 - 19 20 - 24 30 % HIV prevalence 25 - 29 20 30 - 34 35 - 39 10 40 - 44 0 2000 2001 2002 2003 2004 Sources: National HIV and Syphilis Antenatal Sero-Prevalence Survey in South Africa 2004 (South Africa); 2004 ANC Draft Report (Zimbabwe). AIDS epidemic update, December 2005. Fig 6
Distribution of male and female deaths by age group in South Africa, 1997 and 2002 30,000 1997 Male 1997 Female 25,000 2002 Male 2002 Female 20,000 15,000 No. of deaths* 10,000 5,000 0 90+ 0 – 4 5 – 9 15 – 19 20 – 24 25 – 29 30 – 35 36 – 39 40 – 44 45 – 49 50 – 54 55 – 59 60 – 64 65 – 69 70 – 74 75 – 79 80 – 85 85 – 89 10 – 14 Age group *all causes Source: Statistics South Africa, 2005 AIDS epidemic update, December 2005. Fig 7
Trend in HIV prevalence in selected sitesin each province in Mozambique, 2000–2004 North South Centre H.R. Cuamba C.S. Maxixe H.R. Catandica C.S. Ponta-Gea H.R. Montepuez C.S. Xai-Xai C.S. E. Mondlane C.S. 24 de Julho C.S. 25 Setembro C.S. 10 de Junho C.S. No. 3 (Tete) 40 30 % HIV prevalence 20 10 0 2000 2001 2002 2003 2004 Year Source: Ministry of Health, Report on the Update of the HIV Epidemiological Surveillance Data - 2004 Round AIDS epidemic update, December 2005. Fig 8
Data from select antenatal clinic sentinel surveillance sites with a declining trend in HIV prevalence, Kenya 1997–2004 50 Busia Kitui Nairobi Thika 40 Meru Nyeri 30 Garissa % HIV prevalence 20 10 0 1997 1998 1999 2000 2001 2002 2003 2004 Year Source: Ministry of Health - National AIDS/STD Control Programme (NASCOP), HIV Sentinel Surveillance 2004 AIDS epidemic update, December 2005. Fig 9
Modes of transmission for HIV among HIV/AIDS cases,China (2003 estimates) Former commercial blood and plasma donation 24.1% Injecting drug users 43.9% Heterosexual transmission 19.8% Mother-to-child transmission 19.8% Men having sex with men 11.1% Blood and blood products 0.6% Source: State Council AIDS Working Committee & UN Theme Group (2004) AIDS epidemic update, December 2005. Fig 10
Projected impact* of injecting drug use on number of HIV infections in Jakarta, Indonesia Cumulative number of HIV infections 110,000 120 000 HIV infections if nothing changes 100 000 HIV infections in IDUs if nothing changes 80 000 HIV infections if there were no IDU epidemic 60 000 Sexual infections resulting from a chain of infection originating with IDU 36,000 40 000 20 000 2,000 0 1985 1990 1995 2000 2005 2010 * assuming no interventions Source: MAP Report 2005. Drug Injection and HIV/AIDS in Asia AIDS epidemic update, December 2005. Fig 11
Percentage of street-based sex workers who inject drugs, who have sex with injectors, and percentage of male injectors who report buying sex, three cities, Viet Nam 2000 Sex worker injects drugs herself Ho Chi Minh City Sex worker reports sex with male drug injector Haiphong Male injector reports buying sex from sex worker Hanoi 0 10 20 30 40 50 60 70 80 90 100 Percent Source: MAP Reportt 2005. Sex work and HIV/AIDS in Asia. AIDS epidemic update, December 2005. Fig 12
Percentage of male injecting drug users who buy sex – report of consistent condom use during commercial sex, various cities Unprotected commercial sex Bought sex with a condom Hanoi, Vietnam Bangkok, Thailand** Katmandhu Valley, Nepal Surabaya, Indonesia Delhi, India Sichuan, China* Central Bangladesh 0 10 20 30 40 50 60 70 80 90 100 Percent * Sichuan : condom use at last commercial sex ** Bangkok : includes non-injecting drug users Source: MAP Report 2005. Sex work and HIV/AIDS in Asia. AIDS epidemic update, December 2005. Fig 13
HIV prevalence among pregnant women attending antenatal care clinics, Thailand 1990–2004 3.00 Bangkok 2.50 Central 2.00 North 1.50 % HIV prevalence Northeast 1.00 South 0.50 0.00 1990 1991 1992 1993 1994 1995 1996 1997 1998 1999 2000 2001 2002 2003 2004 Year Source: Thailand Ministry of Public Health, Department of Disease Control, Bureau of Epidemiology AIDS epidemic update, December 2005. Fig 14
HIV prevalence among sentinel surveillance groups, Myanmar 1992–2003 ANC Blood donors Military recruits 3.0 2.5 2.0 1.5 % HIV Prevalence 1.0 0.5 0.0 1992 1993 1994 1995 1996 1997 1998 1999 2000 2001 2002 2003 2004 Year Source: Department of Health, AIDS Prevention and Control Project AIDS epidemic update, December 2005. Fig 15
Annual number of newly registered HIV cases and children born HIV-seropositive, Ukraine 1987–2004 14 000 Newly registered HIV cases 12 000 Children born to HIV-positive mothers 10 000 8000 Number of registered HIV cases 6000 4000 2000 0 2004 1987- 1994 1995 1996 1997 1998 1999 2000 2001 2002 2003 Year Source: Ukrainian AIDS Centre AIDS epidemic update, December 2005. Fig 16
HIV prevalence at consistent selected antenatal clinic surveillance sites, Haiti 1993–2004 All women Urban women Semi-urban, rural women 12 10 8 % HIV prevalence 6 4 2 0 1993 1996 2000 2004 Year Source: Ministére de la Santé Publique et de la Population, Analyse secondaire des études de sero surveillance par méthode sentinelle de la prévalence du VIH chez les femmes enceintes en Haϊti entre 1993 et 2004 AIDS epidemic update, December 2005. Fig 17
Reported number of HIV and AIDS cases, Cuba 1986–2003* Number of Cases 900 HIV Cases AIDS Cases 800 700 600 500 400 300 200 100 0 1986 1987 1988 1989 1990 1991 1992 1993 1994 1995 1996 1997 1998 1999 2000 2001 2002 2003 Year *Extrapolations from reported cumulative number of cases as of end 2003 for the years 2002 & 2003 and years with no report Source:Caribbean Technical Expert Group (2004). Strengthening the Caribbean regional response to the HIV/AIDS epidemic: Report of the Caribbean Technical Expert Group on HIV Prevention and Gender. Draft working document. October. Jamaica AIDS epidemic update, December 2005. Fig 18
Comparison of AIDS-related hospitalizations to number of patients on ARV therapy, Brazil 1998–2004 Hospitalized HIV patients Patients on ARV therapy 180,000 70% Rate of hospitalization of patients on ARV treatment 160,000 60% 140,000 50% 120,000 Number of AIDS hospitalization and number of patients on ARV therapy 40% 100,000 Hospitalization rate per year per patient on ARV therapy 80,000 30% 60,000 20% 40,000 10% 20,000 0 0% 1998 1999 2000 2001 2002 2003 2004 Year Source: DATASUS, SIH; National STD/AIDS Program AIDS epidemic update, December 2005. Fig 19
Estimated number of annual AIDS cases, annual AIDS deaths, and persons living with AIDS, United States of America 1985–2003 Number of AIDS cases and deaths (in thousands) Number of persons living with AIDS (in thousands) 100 500 AIDS cases 90 450 AIDS deaths 80 400 Persons living with AIDS 70 350 60 300 50 250 40 200 30 150 20 100 10 50 0 0 1985 1986 1987 1988 1989 1990 1991 1992 1993 1994 1995 1996 1997 1998 1999 2000 2001 2002 2003 Year of diagnosis or death Note: adjusted for reporting delays Source: Centers for Disease Control and Prevention (CDC), Division of HIV/AIDS Prevention AIDS epidemic update, December 2005. Fig 20