MODIS-Derived Photochemical Reflectance Index for Assessing Boreal Forest Light-Use Efficiency
This study utilizes MODIS data to calculate the Photochemical Reflectance Index (PRI) and investigate inter-annual variations in the photosynthetic light-use efficiency (LUE) of a boreal deciduous forest in Saskatchewan. We explored the relationship between PRI and LUE based on flux and meteorological data over cloud-free days from 2001 to 2003. A strong linear relationship (R²=0.76) was found under specific conditions, indicating the potential of using PRI for improving large-scale carbon cycle modeling.

MODIS-Derived Photochemical Reflectance Index for Assessing Boreal Forest Light-Use Efficiency
E N D
Presentation Transcript
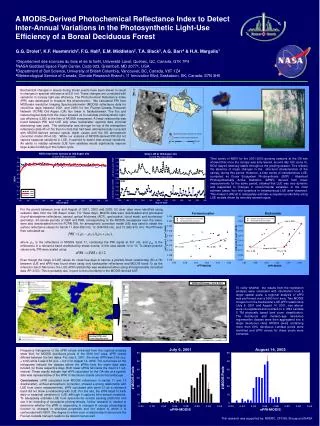
MODIS sPRI image - July 6, 2001 Landsat 5TM Land Cover Classification A MODIS-Derived Photochemical Reflectance Index to Detect Inter-Annual Variations in the Photosynthetic Light-Use Efficiency of a Boreal Deciduous Forest G.G. Drolet1, K.F. Huemmrich2, F.G. Hall2, E.M. Middleton2, T.A. Black3, A.G. Barr4 & H.A. Margolis1 1Departement des sciences du bois et de la forêt, Université Laval, Quebec, QC, Canada, G1K 7P4 2NASA Goddard Space Flight Center, Code 923, Greenbelt, MD 20771, USA 3Department of Soil Science, University of British Columbia, Vancouver, BC, Canada, V6T 1Z4 4Meteorological Service of Canada, Climate Research Branch, 11 Innovation Blvd, Saskatoon, SK, Canada, S7N 3H5 Biochemical changes in leaves during stress events have been shown to result in changes in spectral reflectance at 531 nm. These changes are correlated with variations in canopy light-use efficiency. The Photochemical Reflectance Index (PRI) was developed to measure this phenomenon. We calculated PRI from MODerate resolution Imaging Spectroradiometer (MODIS) reflectance data for cloud-free days between 2001 and 2003 for the Fluxnet-Canada Research Network (FCRN) Old Aspen (OA) flux tower in Saskatchewan. The flux and meteorological data from the tower allowed us to calculate photosynthetic light-use efficiency (LUE) at the time of MODIS overpasses. A linear relationship was found between PRI and LUE only when backscatter spectral data (minimal shadowing) was used. The relationship was stronger for top of the atmosphere reflectance data (R2=0.76) than for data that had been atmospherically corrected with MODIS-derived aerosol optical depth values and the 6S atmospheric correction model (R2=0.53). While our analysis of MODIS-derived PRI did not capture seasonal variations in LUE, it seemed to detect inter-annual variations. An ability to reliably estimate LUE from satellites would significantly improve large-scale modeling of the carbon cycle. NDVI from tower sensors at Old Aspen site (12:00 PM local time) Daily LUE at Old Aspen site (12:00 PM local time) Time series of NDVI for the 2001-2003 growing seasons at the OA site showed that once the canopy was fully-leaved, around day 160 (June 9), NDVI stayed relatively stable throughout the growing season. This reflects the absence of major changes in the structural characteristics of the canopy during this period. However, a time series of instantaneous LUE, computed as Gross Ecosystem Photosynthesis (GEP) / Absorbed Photosynthetically Active Radiation (APAR) derived from tower measurements for the same period, showed that LUE was very dynamic and responded to changes in environmental variables. In the most extreme cases, four fold variations in instantaneous LUE were observed. This makes it difficult to adequately estimate ecosystem productivity using LUE models driven by remotely sensed inputs. 2001 LUE (μmol C μmol-1 APAR) NDVI 2003 LUE (μmol C μmol-1 APAR) Day of year Day of year For the period between June and August of 2001, 2002 and 2003, 52 clear days were identified using radiation data from the Old Aspen tower. For these days, MODIS data were downloaded and processed (top-of-atmosphere reflectance, aerosol optical thickness (AOT), geolocation, cloud mask, and sun/sensor geometry). 30-minute periods of GEP and PAR, corresponding to the MODIS overpasses over the tower, were also downloaded from the FCRN DIS. An atmospheric correction model (6S) was used to obtain the surface reflectance values for bands 11 (526-536 nm), 12 (546-556 nm), and 13 (662-672 nm). The PRI was then calculated as: where r11 is the reflectance in MODIS band 11, containing the PRI signal at 531 nm, and rrefis the reflectance in a reference band unaffected by stress events, in this case bands 12 or 13. To obtain positive values only, PRI were scaled using: Even though the range of LUE values for cloud-free days is narrow, a positive linear relationship (R2=0.76) between LUE and sPRI was found when using only backscatter reflectance and MODIS band 13 as the reference band. Moreover, the LUE-sPRI relationship was weakened when using atmospherically corrected data (R2=0.53). This is probably due, in part, to the uncertainty in the MODIS-derived AOT. Forward scatter Backscatter July 6, 2001 R2= 0.02 R2= 0.08 August 14, 2003 R2= 0.53 R2= 0.76 To verify whether the results from the regression analysis were consistent with information from a larger spatial scale, a regional analysis of sPRI was performed over a 9900 km2 area. Two MODIS images from the backscatter LUE-sPRI relationship (July 6, 2001 and August 14, 2001; see above) were co-registered and overlaid on a 1994 Landsat 5 TM physically based land cover classification. The deciduous and medium-age deciduous regeneration classes were then aggregated into a larger deciduous class. MODIS pixels containing more than 60% deciduous Landsat pixels were identified and sPRI values for these pixels were extracted. Frequency histograms of the sPRI values extracted from the regional analysis show that, for MODIS deciduous pixels in the 9900 km2 area, sPRI values differed between the two dates. For July 6, 2001, the mean sPRI was 0.60 (s.d. = 0.02) while it was 0.55 (s.d. = 0.01) for August 14, 2003. The red arrows on the histograms indicate the classes where the sPRIs from the tower data were located, for these respective days. Both tower sPRIs fell inside the mean ± 1 s.d. interval. These results indicate that sPRI calculated for the OA site at a specific date was representative of the sPRI of deciduous stands across the landscape. Conclusions: sPRI calculated from MODIS reflectance in bands 11 and 13 (backscatter), without atmospheric correction, showed a strong relationship with LUE from tower measurements. sPRI calculated with band 12 as a reference band did not show a relationship with LUE. For this site, the sPRI failed to track daily or seasonal variations in LUE, although it captured inter-annual variations. To adequately estimate LUE from space-borne remote sensing platforms and use it for modeling of ecosystem photosynthesis, further research is needed to determine whether the sPRI is responding to changes in canopy physiological function or changes in structural properties and the extent to which it is confounded with NDVI. The degree to which such a relationship holds across the Fluxnet-Canada transect needs to be determined as well. This research was supported by: NSERC, CFCAS, Biocap and NASA.