Download

1 / 9
90 likes | 179 Vues
Learn how to find the 5-number summary for given data values using a TI-83 calculator and interpreting box-and-whisker plots. Practice with DVD rental data and golf ball distances.

E N D
Box-and-Whisker Ploton the TI-83 Unit 9, Day 4
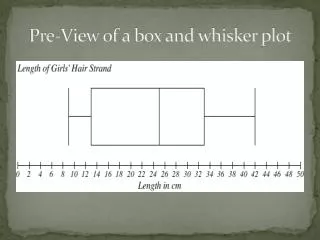
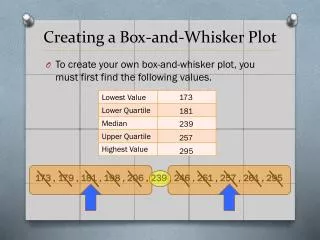
Let’s find the 5 number summary for the data values:85, 100, 97, 84, 73, 89, 73, 65, 50, 83, 79, 92, 78, 10 • First, enter the data values under L1 in your graphing calculator. (Stat, Edit)
Let’s find the 5 number summary for the data values:85, 100, 97, 84, 73, 89, 73, 65, 50, 83, 79, 92, 78, 10 • Press 2nd STATPLOT and choose #1 PLOT 1. Be sure • the plot is ON • the second box-and-whisker icon is highlighted
Let’s find the 5 number summary for the data values:85, 100, 97, 84, 73, 89, 73, 65, 50, 83, 79, 92, 78, 10 • To see the box-and-whisker plot, press ZOOMand #9 ZoomStat. • Press the TRACE key to see on-screen data about the box-and-whisker plot.
Let’s find the 5 number summary for the data values:85, 100, 97, 84, 73, 89, 73, 65, 50, 83, 79, 92, 78, 10 • You can also see the 5 number summary by selecting Stat, Calc, 1: 1-Var Stats
Practice: The number of DVDs rented each day over two weeks at a video rental store are given. Make a box-and-whisker plot of the data. 38 42 50 65 82 91 88 40 34 41 71 93 87 94
Extension Question: The distances, in yards, that Julia and Ty hit 14 golf balls at a driving range are listed below. Julia: 116, 147, 167, 157, 88, 130, 155, 161, 118, 144, 220, 213, 222, 52 Ty: 62, 129, 103, 217, 230, 160, 151, 63, 133, 203, 159, 142, 185, 201 Using the same number line, make a box-and-whisker plot for each person. Interpret Make a conclusion about the data.