
Uploaded by
alice
3 SLIDES
141 VUES
30LIKES
Box-and-Whisker Plot Guide: Understanding 5-Number Summary
DESCRIPTION
Learn how to make a box-and-whisker plot step-by-step with this tutorial. Organize your data, find the median, Q1, Q3, and more. Master the art of visualizing statistical values effectively.
Download

1 / 3
Télécharger la présentation 
Box-and-Whisker Plot Guide: Understanding 5-Number Summary
An Image/Link below is provided (as is) to download presentation
Download Policy: Content on the Website is provided to you AS IS for your information and personal use and may not be sold / licensed / shared on other websites without getting consent from its author.
Content is provided to you AS IS for your information and personal use only.
Download presentation by click this link.
While downloading, if for some reason you are not able to download a presentation, the publisher may have deleted the file from their server.
During download, if you can't get a presentation, the file might be deleted by the publisher.
E N D
Presentation Transcript
Box-and-Whisker PlotRefresher Unit 9, Day 3
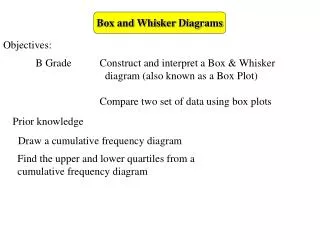
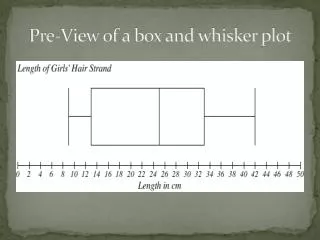
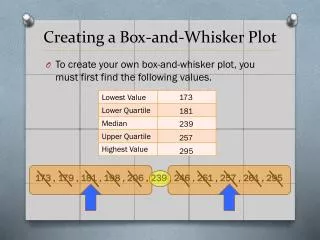
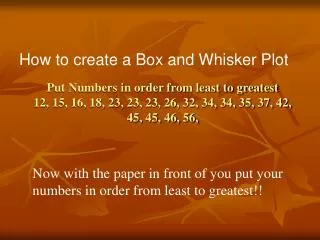
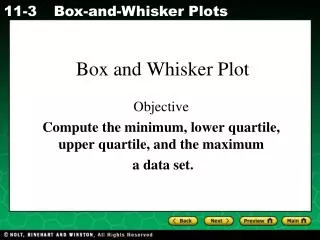
How to make a box-and-whisker plot • Put the data values in order. • Find the Median. • Find the median of the 1st half. This is Q1. • Find the median of the 2nd half. This is Q3. • Draw a number line. • Draw a rectangle above the number line from Q1 to Q3 with a line through it at the median. • Draw whiskers from the box out to the minimum and maximum values.
5 Number Summary • Minimum • Q1 • Median • Q2 • Maximum


More Related
Audio
Live Player