Understanding Applied Univariate Statistics: Multiple Regression Concepts
170 likes | 321 Vues
This course material covers the fundamentals of applied univariate statistics, with a focus on multiple regression. It examines the relationships between a dependent variable and various independent predictors using linear combinations. Key topics include model formulation, significance of predictor selection, assumptions of regression, and addressing common issues like multicollinearity, heteroskedasticity, and outliers. Graphical representations and interpretation of results and statistics such as R-squared and adjusted R-squared are also discussed to aid understanding.

Understanding Applied Univariate Statistics: Multiple Regression Concepts
E N D
Presentation Transcript
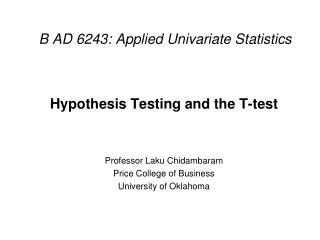
B AD 6243: Applied Univariate Statistics Multiple Regression Professor Laku Chidambaram Price College of Business University of Oklahoma
Basics of Multiple Regression • Multiple regression examines the relationship between one interval/ratio level variable and two or more interval/ratio (or dichotomous) variables • As in simple regression, the dependent (or criterion) variable is y and the other variables are the independent (or predictor) variables xi • The intent of the regression model is to find a linear combination of x’s that best correlate with y • The model is expressed as: Y = 0 + 1Xi + 2X2 … + nXn + I BAD 6243: Applied Univariate Statistics
A Graphical Representation Objective: To graphically represent the equation Y = 0 + 1Exp_X1 + 2RlExp_X2 + I BAD 6243: Applied Univariate Statistics
Selecting Predictors • Rely on theory to inform selection • Examine correlation matrix to determine strength of relationships with Y • Use variables based on your knowledge • Let the computer decide based on data set BAD 6243: Applied Univariate Statistics
Selecting Method of Inclusion • Enter • Enter – Block • Stepwise • Forward selection • Backward elimination • Stepwise BAD 6243: Applied Univariate Statistics
What to Look For? • b-values vs. standardized beta weights (β) • R: represents correlation between observed values and predicted values of Y • R-squared: represents the amount of variance shared between Y and all the predictors combined • Adjusted R-squared BAD 6243: Applied Univariate Statistics
First Order Assumptions • Continuous variables (also see next slide) • Linear relationships between Y and Xs • Sufficient variance in values of predictors • Predictors uncorrelated with external variables BAD 6243: Applied Univariate Statistics
Including Categorical Variables • Dichotomous variables: e.g., Gender • Coded as 0 or 1 • Dummy variables: e.g., Political affiliation • Create d - 1 dummy variables, where d is the number of categories • So, with four categories, you need three dummy variables BAD 6243: Applied Univariate Statistics
Second Order Assumptions • Independence of independent variables • Equality of variance • Normal distribution of error terms • Independence of observations BAD 6243: Applied Univariate Statistics
Violations of Assumptions BAD 6243: Applied Univariate Statistics
Multicollinearity • High correlations among predictors • Can result in: • Lower value of R • Difficulty of judging relative importance of predictors • Increases instability of model • Possible solutions: • Examine correlation matrices, VIFs and tolerances to judge if predictor(s) need to be dropped • Rely on computer assisted means • Other options BAD 6243: Applied Univariate Statistics
Heteroskedasticity • Systematic increase or decrease in variance • Can result in: • Confidence intervals being too wide or narrow • Unstable estimates • Possible solutions: • Transform data • Other options BAD 6243: Applied Univariate Statistics
Outliers • Undue influence of extreme values • Can result in: • Incorrect estimates and inaccurate confidence intervals • Possible solutions: • Identify and eliminate value(s), but … • Transform data • Other options BAD 6243: Applied Univariate Statistics
Autocorrelation • Observations are not independent (typically, observations over time) • Can result in: • Lower standard error of estimate • Lower standardized beta values • Possible solutions: • Search for key “missing” variables • Cochrane-Orcutt Procedure • Other options BAD 6243: Applied Univariate Statistics
A Graphical Representation BAD 6243: Applied Univariate Statistics