Download
1 / 11
110 likes | 315 Vues
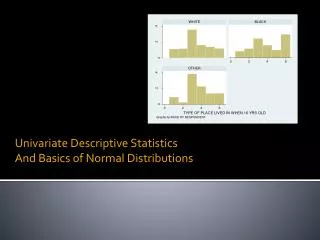
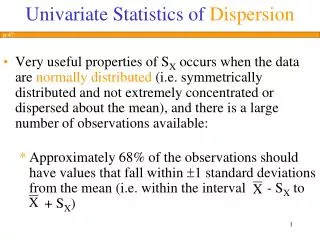
Univariate Statistics of Dispersion. p 47. Very useful properties of S X occurs when the data are normally distributed (i.e. symmetrically distributed and not extremely concentrated or dispersed about the mean), and there is a large number of observations available:

E N D
Univariate Statistics ofDispersion p 47 • Very useful properties of SX occurs when the data are normally distributed (i.e. symmetrically distributed and not extremely concentrated or dispersed about the mean), and there is a large number of observations available: • Approximately 68% of the observations should have values that fall within 1 standard deviations from the mean (i.e. within the interval - SX to ( + SX)
Univariate Statistics ofDispersion p 47 • Approximately 95% of the observations should have values that fall within 2 standard deviations from the mean (i.e. within the interval - 2SX to ( + 2SX)
Univariate Statistics ofDispersion p 47 • The variance (S2X) is the square of the standard deviation: • (3.7)
Univariate Statistics ofDispersion p 47 • It provides the same information about the variable of interest contained in the standard deviation, but it is often used as the main measure of dispersion in statistics • The numerator in the variance is considered a measure of the total variation in
Linear Transformations • In applied statistics, sometimes is convenient to define and create a new variable as a transformation of an existing one, i.e.: • Yi = f(Xi) for all i
Linear Transformations • If we know and SX, and the transformation is linear, there is a simple way to calculate and SY directly from and SX; for instance if: • Yi = a + bXi for all i, then • = a + b
Linear Transformations • In addition: • S2Y = b2S2X and SY = |b|SX
Bivariate Statistics p 53 • The ultimate objective of regression analysis is to determine if and how certain (independent) variables influence another (dependent) variable • Bivariate statistics can be used to examine the degree in which two variables are related, without implying that one causes the other
Bivariate Statistics p 54 • In Figure 3.3 (a) Y and X are positively but weakly correlated while in 3.3 (b) they are negatively and strongly correlated
Bivariate Statistics: Covariance p 53 • The covariance is one measure of how closely the values taken by two variables Y and X vary together: • (3.17) • A disadvantage of the covariance statistic is that its magnitude can not be easily interpreted, since it depends on the units in which we measure Y and X
Bivariate Statistics: Correlation Coefficient p 54 • The related and more used correlation coefficient remedies this disadvantage by standardizing the deviations from the mean: • (3.18)