Download
1 / 12
120 likes | 333 Vues
The Line Graph. Created by Alec Lanter , Gregory Woodward, and Nathan Withers. Pd. 4. What is a line graph?.

E N D
The Line Graph Created by Alec Lanter, Gregory Woodward, and Nathan Withers Pd. 4
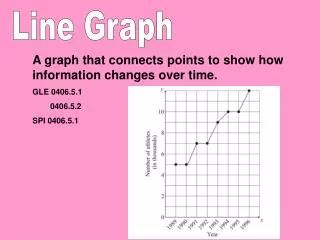
What is a line graph? • A visual representation of data in which data is displayed on quadrant 1 of the coordinate plane. The vertical y axis contains values of y, the dependent variable, and the horizontal x axis contains values of x, the independent variable. The x values are almost always expressed as a time measurement or unit. There are several dots (ordered pairs) in the quadrant that are connected with line segments to display a trend in the data.
When would you use one? • When trying to depict a change over time with data. • Example. You could use a line graph if you wanted to see a change in your weight over a period of time after going on a diet.
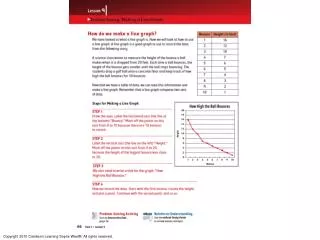
Range (y axis) A labeled line graph. Domain (x axis) *This graph shows the fluctuation of the discharge of a river throughout a year. Note that the discharge of the river is considerably higher in some months than others.
Necessary Data • It is best to use a line graph if time is part of the data you acquire. The x-axis would contain the time data and the y-axis would be whatever measurable outcome that was found in response to the time/time taken. So… • X-axis = time (ex. months of the year) • Y-axis = whatever measurable data that was found (ex. discharge rate of a river)
Time of the Day Alertness Level (scale: # 1-10) Gregory Alec Nathan 8:00 6 6 10 10:00 6 8 8 12:00 7 9 9 2:00 8 10 7 4:00 10 8 10 6:00 8 7 8 8:00 6 5 7 10:00 1 4 5 Data Table Y (measured value in response to time) X(time) AM PM
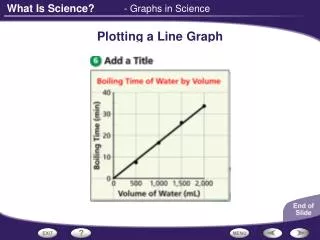
How to make a line graph (explanation) • Determine a domain and range (independent and dependent variable) • Use only quadrant 1 in the coordinate plane. • Make the domain the X-axis and the range the Y-axis and in doing so, write the appropriate numbers for the x and y. Make sure they go up by constant intervals.* • Give the x and y axes appropriate titles. Make sure that the x axes is expressed as a unit or measure of time. • Organize the data into ordered pairs. • Plot the ordered pairs. • Draw a line through all of the ordered pairs. • Create a suitable title for your line graph. • Write the title above the graph itself. *If not, put a squiggle between zero and the first value if the value immediately start a constant interval past zero.
Problem Use the graph provided to solve this problem. What are the three lowest alertness levels (one for each person) and at what times do they occur? Assuming that a school day surpasses Arcola’s end time of 2:50PM, at (or between) what times should our most rigorous course be taken?
Advantages for a line graph • You can easily represent data involving time. • You can see trends or increases and decreases as a result of passing time in one graph. • They are visually easy to understand.
Disadvantages for a line graph • Easily “crowded” and hard to interpret data if there are multiple trials in the same graph. • You can only really graph data involving time.
Acknowledgements Page Google Images in general • http://betterevaluation.org/evaluation-options/LineGraph(for the example line graph) Microsoft Clip Art Gallery • (for first slide picture)