Learn How to Create a Line Graph in Excel: A Step-by-Step Guide
This guide by Tim Hoblitzell demonstrates the simple process of creating line graphs using Excel. Excel offers a variety of tools for organizing, visualizing, and calculating your data, making it essential for businesses. Line graphs are vital for showcasing business performance over time, such as revenue trends or sales growth. The guide explains how to properly label your data, highlight important information, and select the appropriate chart type to effectively visualize your data. Enhance your data analysis skills with this accessible tutorial.


Learn How to Create a Line Graph in Excel: A Step-by-Step Guide
E N D
Presentation Transcript
How to Create a Line Graph Using Excel Tim Hoblitzell
What Excel Offers • Excel offers many different things to do with data such as : • Creating charts based on the data that you provide. • Organizing data • Creating tables • Calculating the data based on different formulas
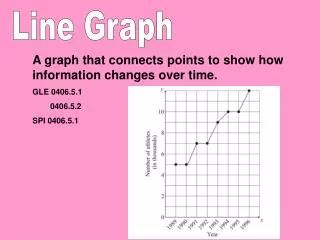
Why You Need To Know How To Create A Line Graph • Line Graphs are very important when it comes to businesses. • Some uses for a line graph are : • Show how your business is doing, such as revenue. • Show how sales are doing over a certain time period • Showing the companies growth.
Writing Data • If you plan to use Excel for organizing data, you are going to want to label your data. • You would normally use row one as your title cells • Following that, row two is when you start writing data.
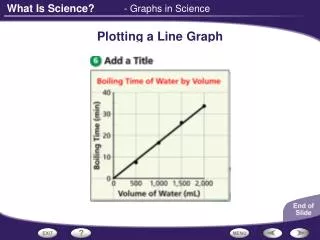
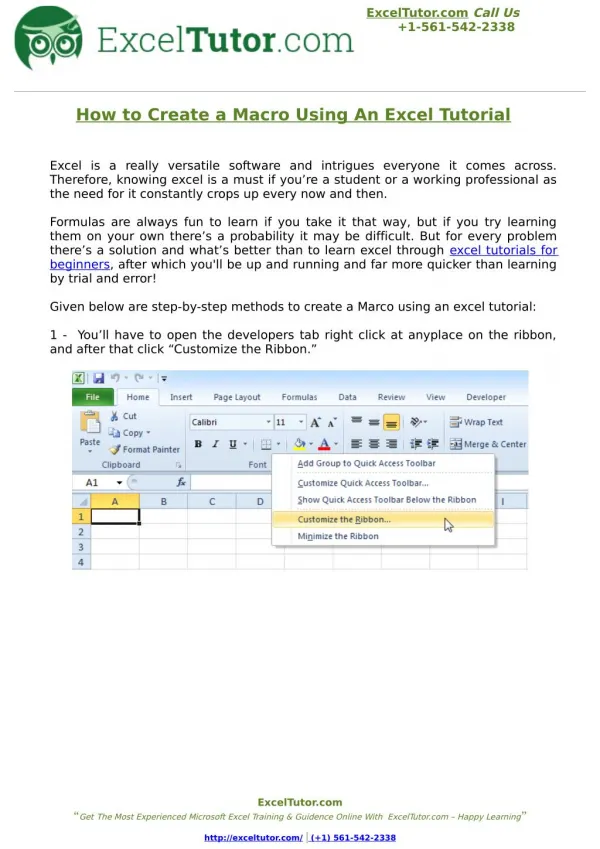
Creating a Line Chart You want to highlight the data you want to make the chart about. After highlighting the Data go to the tab the arrow is pointed to.
Creating a Chart Cont. • These are the choices you have to chose from when creating a chart. You are going to want to click this one.
What It Looks Like This is an example of a Line Graph based of data used in Excel.