Download
1 / 43
460 likes | 931 Vues
Urban Meteorology. Rick Peltier Sangil Lee. Chris Hennigan Ehsan Arhami. The Urban Heat Island. Urban Heat Island. The increased air temperatures in urban areas as contrasted to the cooler surrounding rural areas. Source: Lawrence Berkeley National Lab. Rapid Urbanization.

E N D
Urban Meteorology Rick Peltier Sangil Lee Chris Hennigan Ehsan Arhami
Urban Heat Island • The increased air temperatures in urban areas as contrasted to the cooler surrounding rural areas. Source: Lawrence Berkeley National Lab.
Rapid Urbanization • Lack of surface water (soil water) and vegetation. • Low short-wave reflectivity (albedo). • increased heat release. Source: EPA & Rice University
Mesoscale circulation and convection Gradient wind condition Stagnant condition Source: NASA Global Hydrology and Climate Center
Mesoscale circulation and convection Convective precipitation associated with the excess heat. Source: NASA Global Hydrology and Climate Center
Mesoscale circulation and convection • Mean monthly rainfall during the warmer season (May ~ Sept.) from 1998~2000. • Increased precipitation (7 ~ 50% greater). • Maximum rainfall rates (48 ~116 % greater) downwind of major cities. Source: NASA Global Hydrology and Climate Center
Air Quality Issues Urban heat islands are not only uncomfortably hot, they are also smoggier. (i.e., the incidence of smog increases by 3% per °F above 70°F.) Source: Heat Island Group, Lawrence Berkeley National Lab. & NASA Global Hydrology and Climate Center
Urban Pollution Dispersion Topographical Effects of Urban Area Picture from: corbis.com
Overview • Effect of Topography on Flow • Urban Boundary Layer • Urban Canopy
Internal Boundary Layer fetch Geographically Modified Flow Pictures from: Stull book
Urban Boundary Layer Picture from: Fisher et al. report
Sketch of Urban Boundary Layer and Urban Plume Pictures from: Stull book
Layers Within The Urban Boundary Layer Picture from: Stull book
2 m/s Recirculation eddy 10% of free stream velocity What Happens to Wind Profile Between the Buildings Wind Velocity Pollutant Distribution Pictures from: Gerdes et al., paper
Large reverse Pollutant Dispersion in Urban Street Canopies Pictures from: Xia et al., paper
Low Building High Building Identical Building Upstream Pictures from: Xia et al., paper
Urban Meteorology – case studies • Tehran, Iran • Graz, Austria • Sydney, Australia • Atlanta, GA
Tehran, Iran From www.lonelyplanet.com
City center Tehran, Iran Alborz Mountains From www.lib.utexas.edu/maps/historical/tehran_iran_1947.jpg
Tehran Pollution From Asadollah-Fardi
Valley Pollution Dispersion From www.uoregon.edu/dpardue/overheads/mainpage/overheads-entire.html
Valley Circulation From http://bigmac.civil.mtu.edu/public_html/classes/ce459/study.html
Graz, Austria From www.siteatlas.com
Graz, Austria From www.atlapedia.com
Graz Pollution Pollution Event – January 7, 1991 From Sturm, Almbauer, Kunz
Mountain Lee Phenomenon From www.atsb.gov.au/public/facts/turbulence.cfm
Sydney, Australia From http://www.ga.gov.au/map/images.html
Sydney, Australia From www.ga.gov.au/map.images.html
Sydney Pollution • From 1980 to 1992, Sydney averaged 20 days per year with peak O3 > 80 ppb • Diurnal O3 variation From Physick
Sea Breeze From USA Today
Atlanta, GA Atlanta Supersite, 1999 UGA Agricultural Research Station – Griffin, GA
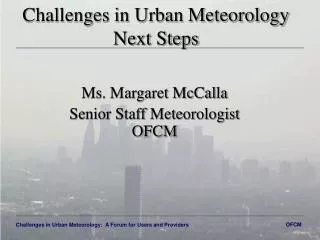
The Urban Environment - Overview • Regional and local scale models often do not predict very local conditions • Urban-Specific Problems • Indoor/Outdoor correlations • Socioeconomic status (SES)
Urban-Specific Problems • Local (unmodelled/unmeasured) Exposures • Urban Heat Island • Humidity/Heat Index • Stress • Pollutant Specifics and the Urban Environment
Urban Health – Air Toxics • Typically increased (small) local sources of air toxics • 1,3-Butadiene, benzene, etc • Very source specific
Indoor/Outdoor “Meteorology” • Harsh Urban Environment Mitigation (A/C, etc.) • Meteorology drives people inside/outside • Meteorological Phenomena sensitivity
Urban Health - SES • Urban sites typically populated by many low-SES families • Low SES = increased susceptibility
Our Urban Environment? • Tehran – ~12,000 persons/sq km • Graz – 4730 persons/sq km • Sydney – 2474 persons/sq km • Atlanta – 1303 persons/sq km
Summary/Conclusions • Urban Heat Island • Urban Topography • Case Studies of the Urban Environment • Applications in the Urban Environment
References • Stull R. B., An introduction to boundary layer meteorology, Kluwer Academic Publishers, 1988, 596-612. • Fisher B., Kukkonen J. and Schatzmann M., Meteorology applied to urban air pollution problems COST 715, Report from atmosphericenvironment website. • Gerdes, F., Olivari, D., 1999. Analysis of pollutant dispersion in an urban street canyon, Journal of Wind Engineering and Industrial Aerodynamics 82, 105-124. • www.corbis.com • Xia J. and Leung D.Y.C., Pollutant dispersion in urban street canopies, Atmospheric Environment 35 (2001) 2033-2043. • Asadollah-Fardi, G. “Air Quality Management in Tehran,” www.unescap.org • Physick, W.L. “Photochemical smog studies in Australian cities,” Urban Air Pollution, Volume 2. ed. H. Power and N. Moussiopoulos. Computational Mechanics Publications, 1996. • Sturm, P.J., R. A. Almbauer, and R. Kunz. “Air quality study for the city of Graz, Austria,” Urban Air Pollution, Volume1. ed. H. Power, N. Moussiopoulos, and C.A. Brebbia. Computational Mechanics Publications, 1994. • Heat Island Group, Lawrence Berkeley National Lab. & NASA Global Hydrology and Climate Center
Questions? • Classmates – Free! • Dr Wang - $5 per question